

Technical analysis
Natural Gas Wave Analysis – 1 July, 2019
July 01, 2019 @ 17:17 +03:00

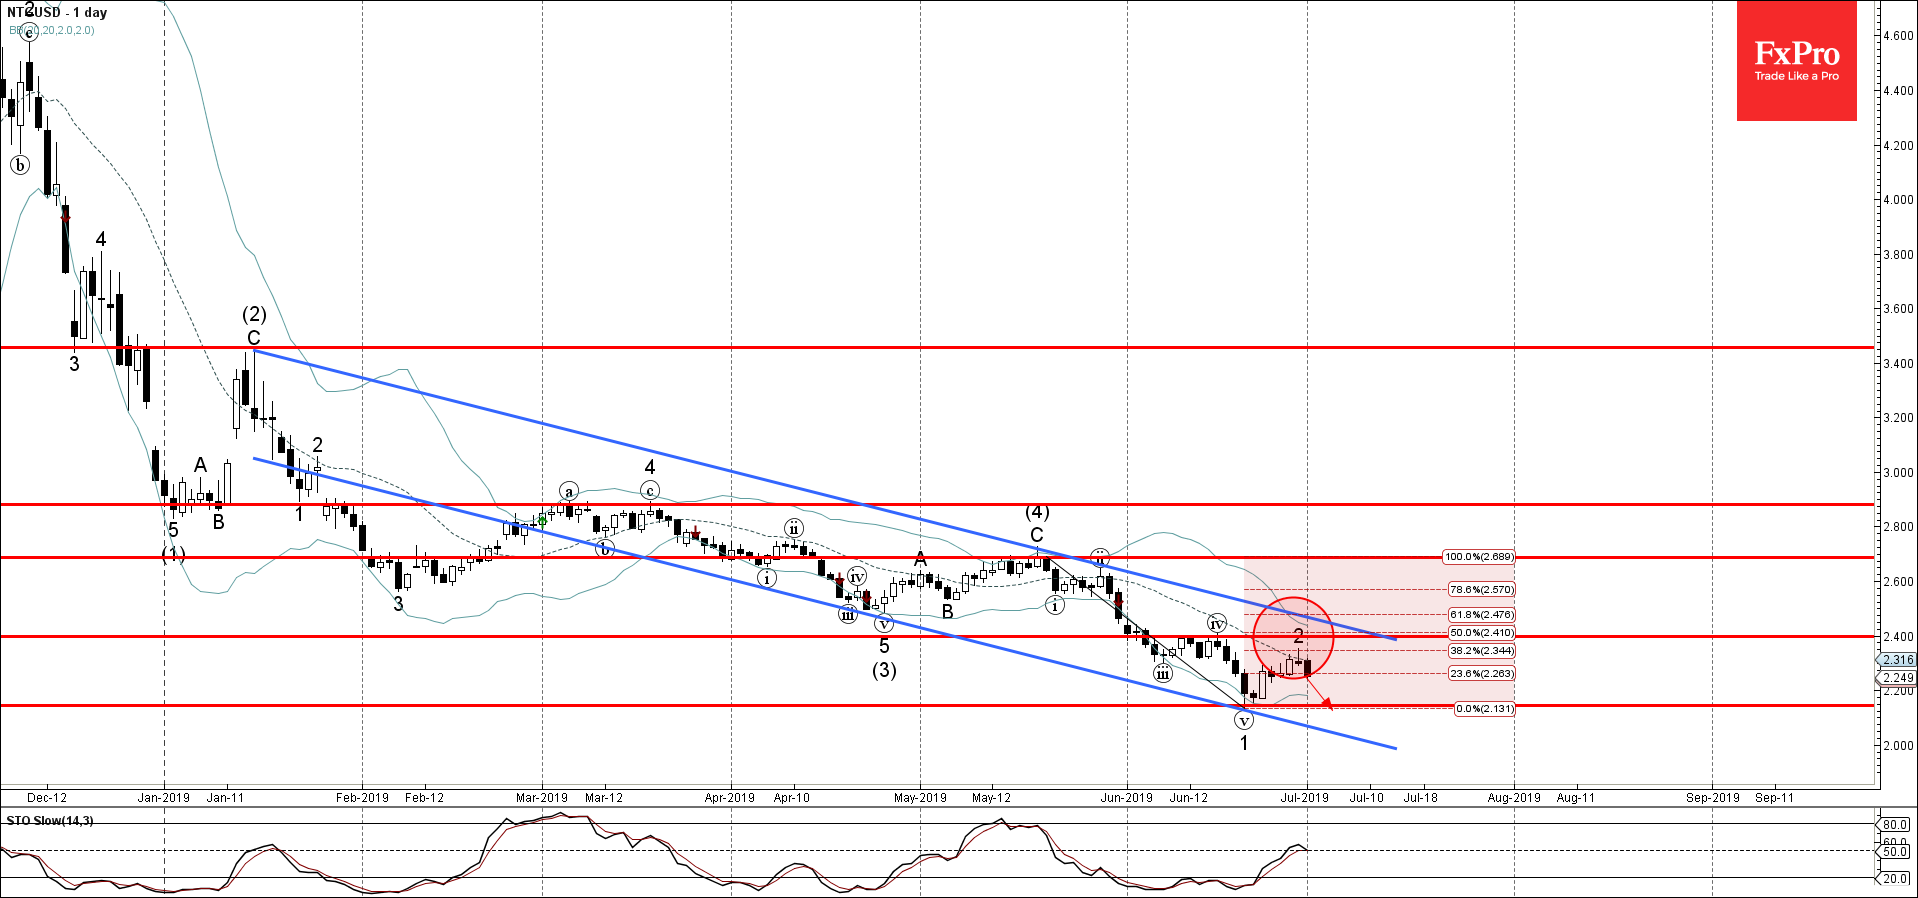
- Natural Gas reversed from resistance area
- Further losses are likely
Natural Gas recently reversed down from the resistance area lying between the resistance level 2.400 (top of the previous wave (iv) in June), upper daily Bollinger Band and the 50% Fibonacci correction of the previous downward impulse 1 from May.
The downward reversal from this resistance area started the active short-term impulse wave 3 of the medium-term impulse sequence (5) from May.
Natural Gas is expected to fall further and retest the next support level 2.145 (low of the previous impulse wave 1).
Related Articles

EURGBP Wave Analysis 24 April 2024
April 24, 2024 @ 21:42 +03:00

EURJPY Wave Analysis 24 April 2024
April 24, 2024 @ 21:40 +03:00

WTI crude oil Wave Analysis 23 April 2024
April 23, 2024 @ 22:47 +03:00

USDCAD Wave Analysis 23 April 2024
April 23, 2024 @ 22:46 +03:00