

Technical analysis
Nasdaq 100 Wave Analysis 2 February, 2021
February 02, 2021 @ 18:45 +03:00

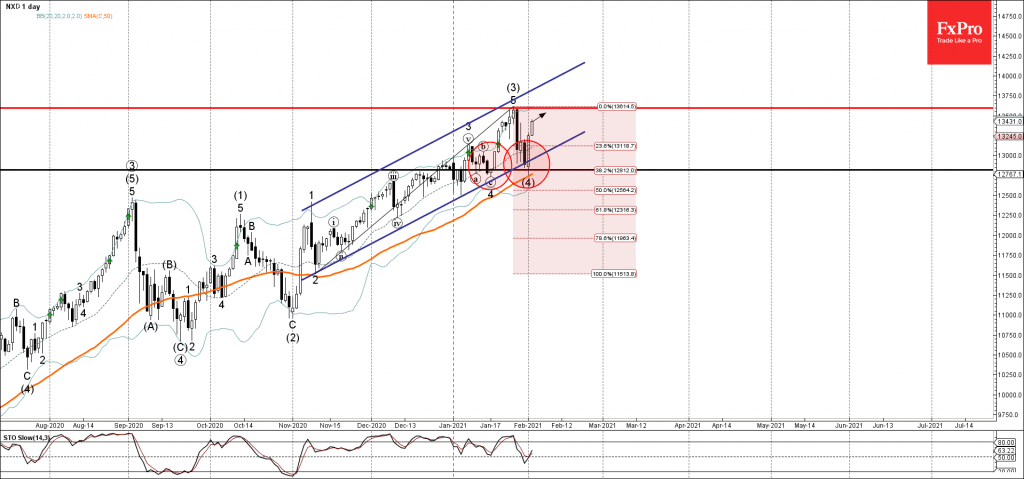
• Nasdaq 100 reversed from support level 12815.00
• Likely to test resistance level 13600.00
Nasdaq 100 index previously reversed up from the key support level 12815.00 (low of the Morning Star from January), intersecting with the lower daily Bollinger Band and the 50-day moving average.
The upward reversal from the support level 12815.00 created the daily candlestick reversal pattern Bullish Engulfing – which started the active impulse wave (5).
Nasdaq 100 index can be expected to rise further toward the next resistance level 13600.00 (top of the pervious impulse wave (3) from January).
Related Articles

EURGBP Wave Analysis 24 April 2024
April 24, 2024 @ 21:42 +03:00

EURJPY Wave Analysis 24 April 2024
April 24, 2024 @ 21:40 +03:00

WTI crude oil Wave Analysis 23 April 2024
April 23, 2024 @ 22:47 +03:00

USDCAD Wave Analysis 23 April 2024
April 23, 2024 @ 22:46 +03:00