

Technical analysis
IBM Wave Analysis – 14 May, 2020
May 14, 2020 @ 17:49 +03:00
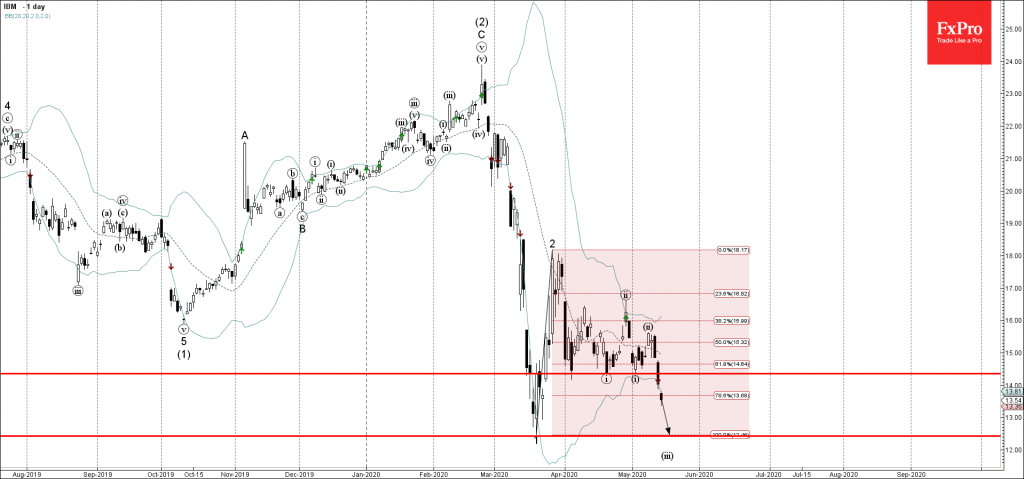
• IBM broke support zone
• Likely to fall to 12.40
IBM today broke the support zone lying between the pivotal support level 14.35 (which has been reversing the price from March) and the 61.8% Fibonacci correction of the upward correction 2.
The breakout of this support zone is aligned with the active minor impulse wave (iii) of the long-term impulse waves 3 and (3).
IBM is likely to fall further toward the next strong support level 12.40 (low of the previous sharp impulse wave 1 from March).
Related Articles

WTI crude oil Wave Analysis 23 April 2024
April 23, 2024 @ 22:47 +03:00

USDCAD Wave Analysis 23 April 2024
April 23, 2024 @ 22:46 +03:00

Intel Wave Analysis 19 April 2024
April 19, 2024 @ 22:12 +03:00

GBPUSD Wave Analysis 19 April 2024
April 19, 2024 @ 22:11 +03:00