

Technical analysis
Home Depot Wave Analysis – 15 November, 2019
November 15, 2019 @ 16:39 +03:00
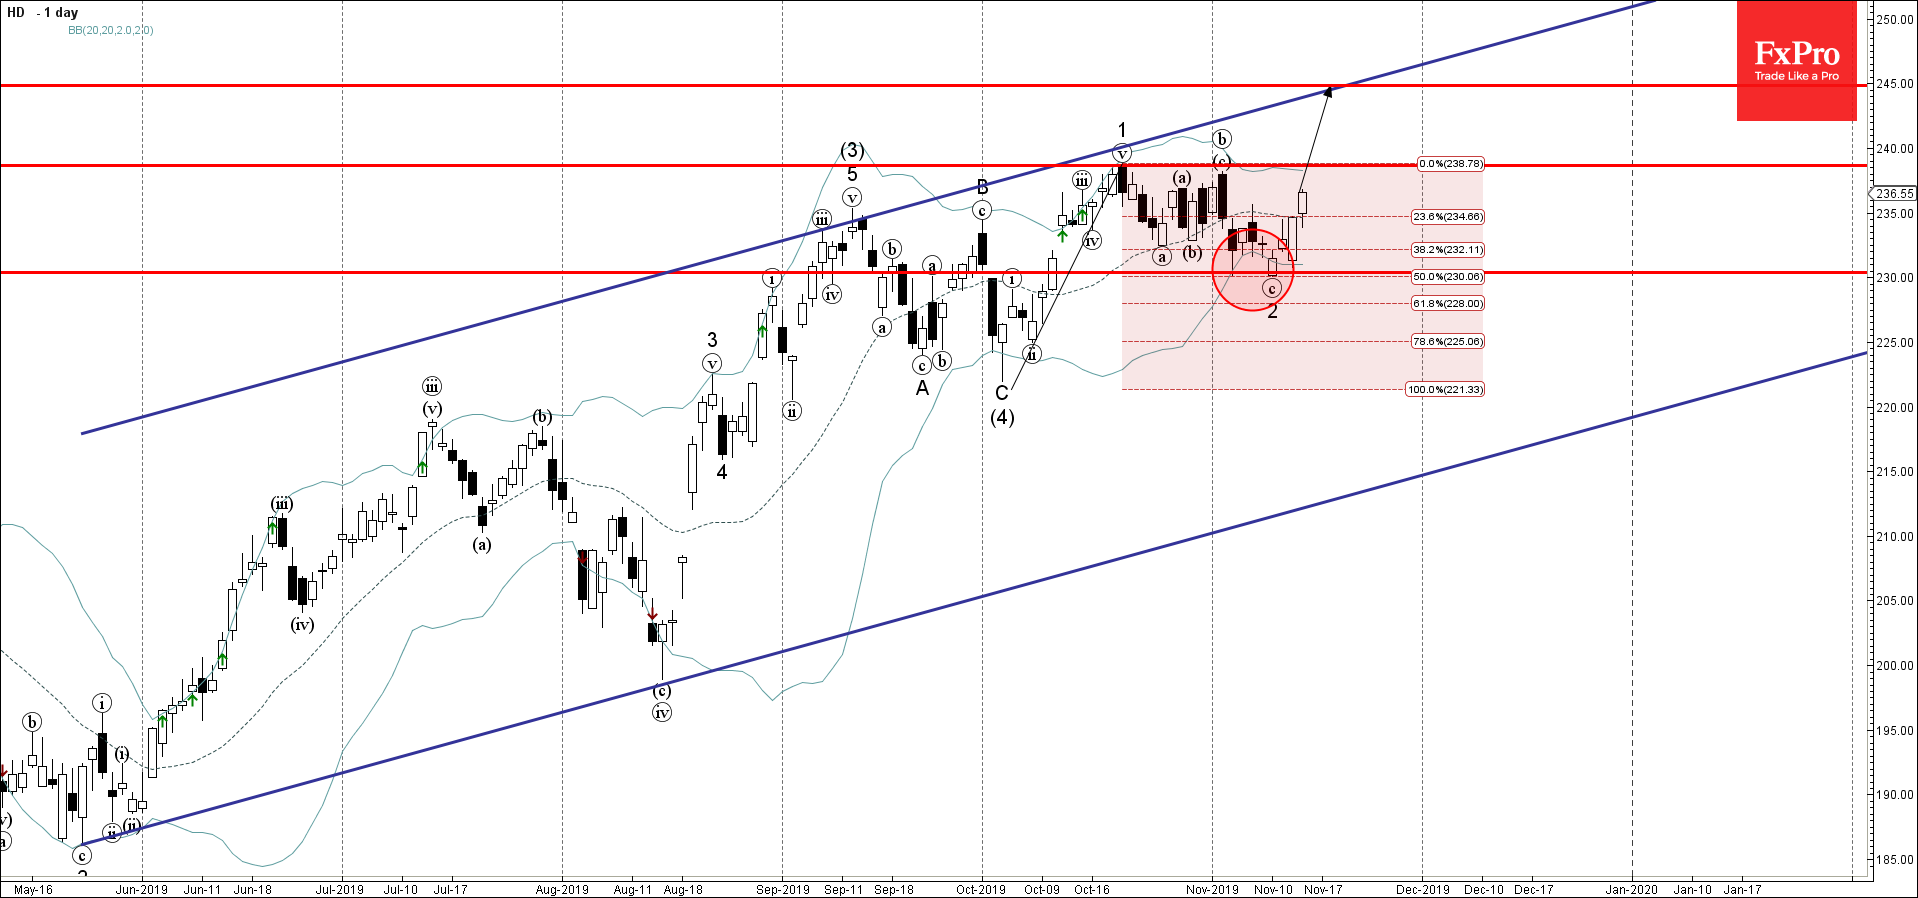
- Home Depot reversed from support area
- Likely to rise to 238.60 and 245.00
Home Depot recently reversed up from the support zone located at the intersection of the support level 230.0 (which also reversed the price at the start of this month), lower daily Bollinger Band and the 50% Fibonacci correction of the previous upward impulse 1 from October.
The upward reversal from this support area started the active short-term impulse wave 3 – which belongs to the intermediate upward impulse sequence (5) from last month.
Home Depot is expected to rise further toward the next resistance level 238.60 (top of impulse 1) – followed by 245.00.
Related Articles

Intel Wave Analysis 19 April 2024
April 19, 2024 @ 22:12 +03:00

GBPUSD Wave Analysis 19 April 2024
April 19, 2024 @ 22:11 +03:00

EURJPY Wave Analysis 18 April 2024
April 18, 2024 @ 23:09 +03:00

EURUSD Wave Analysis 18 April 2024
April 18, 2024 @ 23:08 +03:00