

Technical analysis
Gold Wave Analysis 30 October, 2020
October 30, 2020 @ 18:31 +03:00

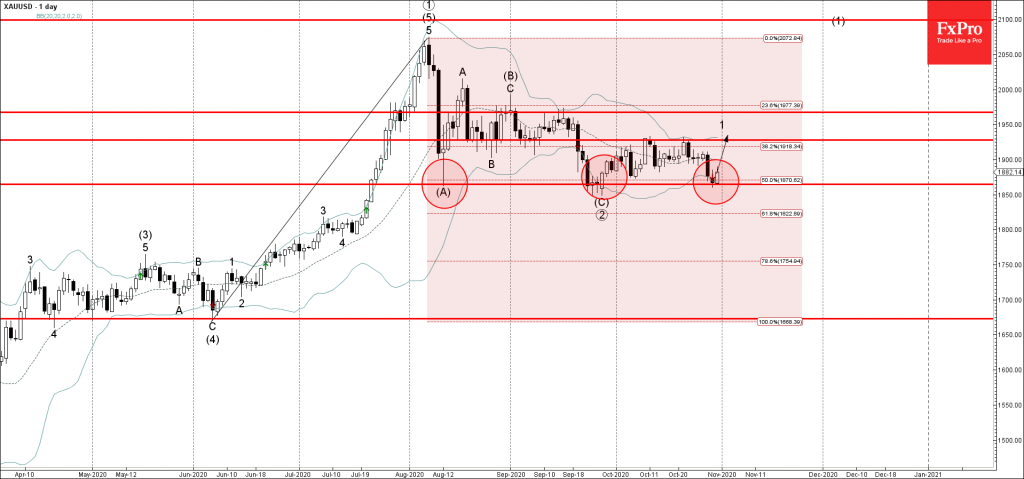
• Gold reversed from support area
• Likely to rise to 1930.00
Gold recently reversed up from the support area located between thelong-term support level 1865.00 (which has been reversing the price from August) and the lower daily Bollinger Band.
This support area was further strengthened by the 50% Fibonacci correction of the upward price impulse (5) from the start of June.
Gold is likely to rise further toward the next resistance level 1930.00 (which reversed the price twice earlier this month).
Related Articles

WTI Wave Analysis 17 April 2024
April 17, 2024 @ 22:40 +03:00

EURGBP Wave Analysis 17 April 2024
April 17, 2024 @ 22:38 +03:00

Citigroup Wave Analysis 16 April 2024
April 16, 2024 @ 22:06 +03:00

USDJPY Wave Analysis 16 April 2024
April 16, 2024 @ 22:05 +03:00