

Technical analysis
Gold Wave Analysis 13 November, 2020
November 13, 2020 @ 18:21 +03:00

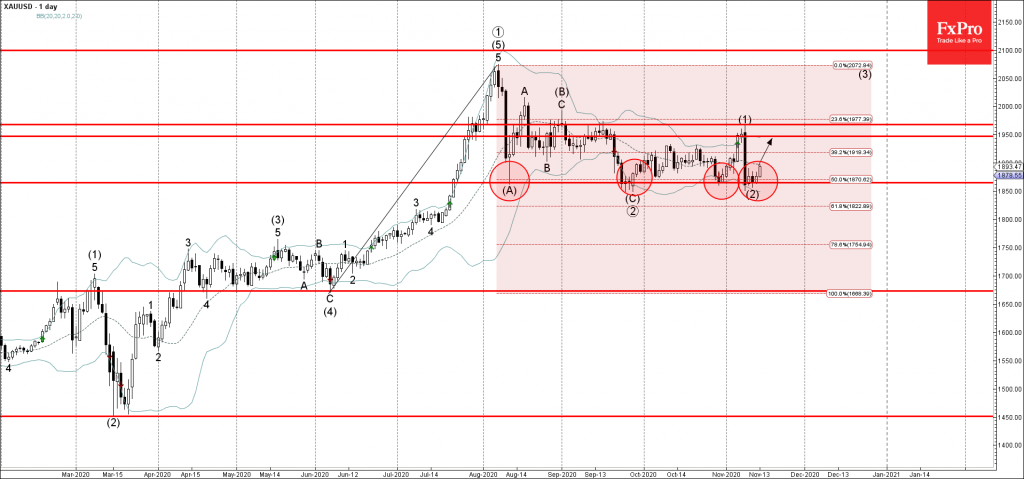
• Gold reversed from support zone
• Likely to rise to 1967.00
Gold continues to rise after the earlier upward reversal from the support zone located between the support level 1865.00 (which has been reversing the price from August), lower daily Bollinger Band and the 50% Fibonacci correction of the upward impulse from June.
The upward reversal from this support zone started the active medium-term impulse wave (3).
Given the predominant uptrend – Gold is likely to rise further toward the next resistance level 1967.00 (top of the previous impulse wave (1)).
Related Articles

WTI crude oil Wave Analysis 23 April 2024
April 23, 2024 @ 22:47 +03:00

USDCAD Wave Analysis 23 April 2024
April 23, 2024 @ 22:46 +03:00

Intel Wave Analysis 19 April 2024
April 19, 2024 @ 22:12 +03:00

GBPUSD Wave Analysis 19 April 2024
April 19, 2024 @ 22:11 +03:00