

GBPCHF Wave Analysis 4 February, 2021
February 04, 2021 @ 18:33 +03:00

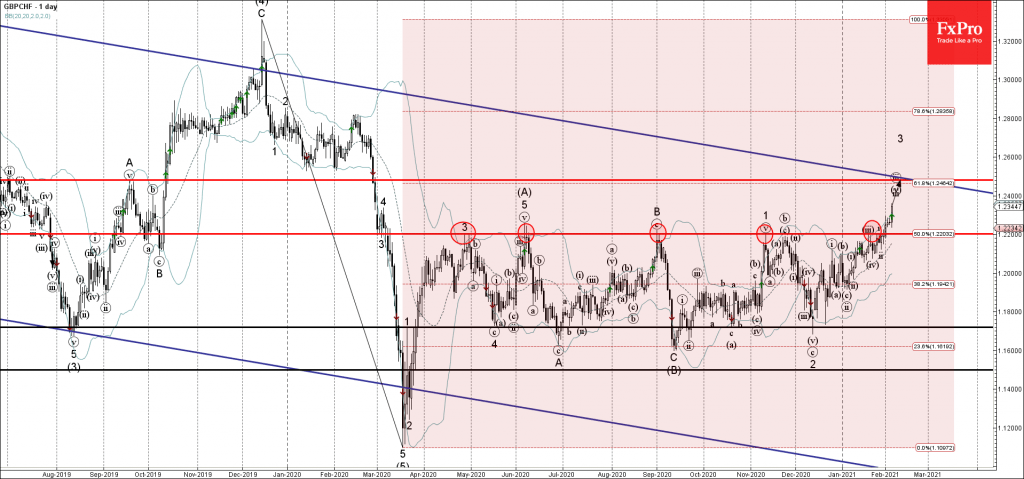
• GBPCHF broke multi-month resistance level 1.2200
• Likely to reach resistance level 1.2480
GBPCHF recently broke the powerful multi-month resistance level 1.2200 (which has been repeatedly reversing this currency pair from last April – as can be seen from the daily GBPCHF chart below).
The breakout of the resistance level 1.2200 coincided with the breakout of the 50% Fibonacci correction level of the sharp downward impulse (5) from December of 2019 to March of 2020.
GBPCHF is expected to rise further toward the next resistance level 1.2480 (61.8% Fibonacci correction level of the aforementioned downward impulse (5) from 2019).

April 24, 2024 @ 21:42 +03:00

April 24, 2024 @ 21:40 +03:00

April 23, 2024 @ 22:47 +03:00

April 23, 2024 @ 22:46 +03:00