

Technical analysis
GBPCHF Wave Analysis 28 September, 2020
September 28, 2020 @ 17:17 +03:00

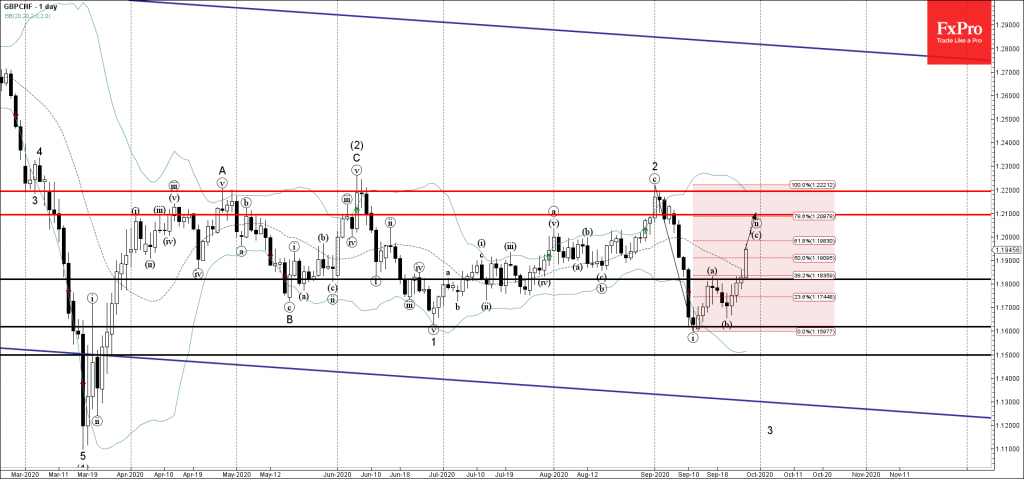
• GBPCHF broke the resistance area
• Likely to rise to 1.2100
GBPCHF recently broke the resistance area lying between the resistance level 1.1820 (former top of the previous minor impulse wave (a)) and the 38.2% Fibonacci correction of the downward impulse (i) from the end of August.
The breakout of this resistance area should accelerate the active impulse wave (c) of the ABC correction (ii) from the start of September.
GBPCHF is expected to rise further toward the next resistance level 1.2100 (target price for the completion of the active impulse wave (c)).
Related Articles

Intel Wave Analysis 19 April 2024
April 19, 2024 @ 22:12 +03:00

GBPUSD Wave Analysis 19 April 2024
April 19, 2024 @ 22:11 +03:00

EURJPY Wave Analysis 18 April 2024
April 18, 2024 @ 23:09 +03:00

EURUSD Wave Analysis 18 April 2024
April 18, 2024 @ 23:08 +03:00