

Technical analysis
GBPCAD Wave Analysis 14 October, 2020
October 14, 2020 @ 17:35 +03:00

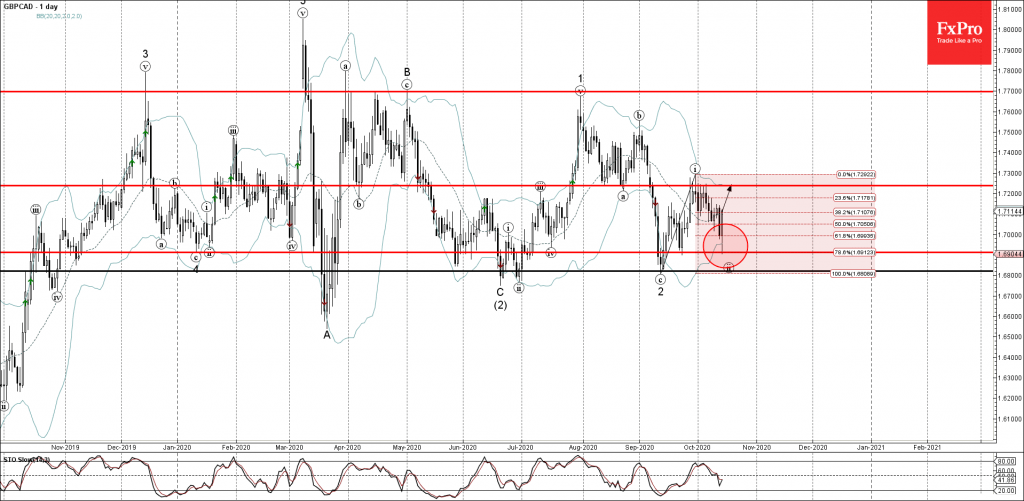
• GBPCAD reversed from support area
• Likely to rise to 1.7240
GBPCAD recently reversed up from the support area located between the previous support pivot from September 1.6910 and the lower daily Bollinger Band.
The upward reversal from this support area is likely to create the daily Japanese candlesticks reversal pattern Piercing Line if the pair closes today near the current levels.
GBPCAD is likely to rise further toward the next resistance level 1.7240 (which reversed the price multiple times from the end of September).
Related Articles

Intel Wave Analysis 19 April 2024
April 19, 2024 @ 22:12 +03:00

GBPUSD Wave Analysis 19 April 2024
April 19, 2024 @ 22:11 +03:00

EURJPY Wave Analysis 18 April 2024
April 18, 2024 @ 23:09 +03:00

EURUSD Wave Analysis 18 April 2024
April 18, 2024 @ 23:08 +03:00