

Technical analysis
Facebook Wave Analysis – 1 July, 2020
July 01, 2020 @ 17:26 +03:00
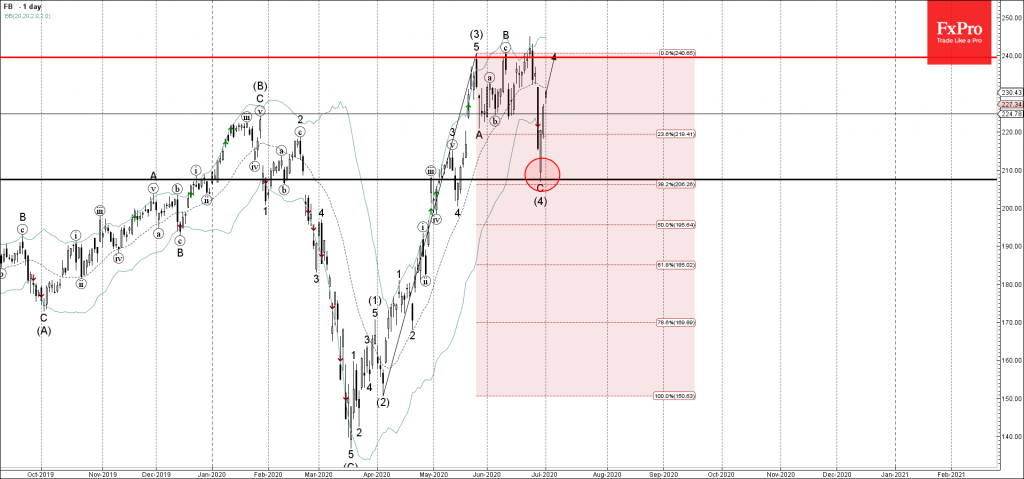
• Facebook started impulse wave (5)
• Likely to reach 240.00
Facebook continues to rise inside the strong medium-term impulse wave (5) which started earlier from the support area lying between the lower daily Bollinger band and the 38.2% Fibonacci retracement of the previous extended impulse wave form April.
The upward reversal from the aforementioned support area created the daily candlesticks reversal pattern Piercing Line. Facebook is likely to rise further toward the next resistance level 240.00 (which stopped the previous sharp waves (3) and B).
Related Articles

EURJPY Wave Analysis 18 April 2024
April 18, 2024 @ 23:09 +03:00

EURUSD Wave Analysis 18 April 2024
April 18, 2024 @ 23:08 +03:00

WTI Wave Analysis 17 April 2024
April 17, 2024 @ 22:40 +03:00

EURGBP Wave Analysis 17 April 2024
April 17, 2024 @ 22:38 +03:00