

Technical analysis
Exxon Wave Analysis 14 April, 2021
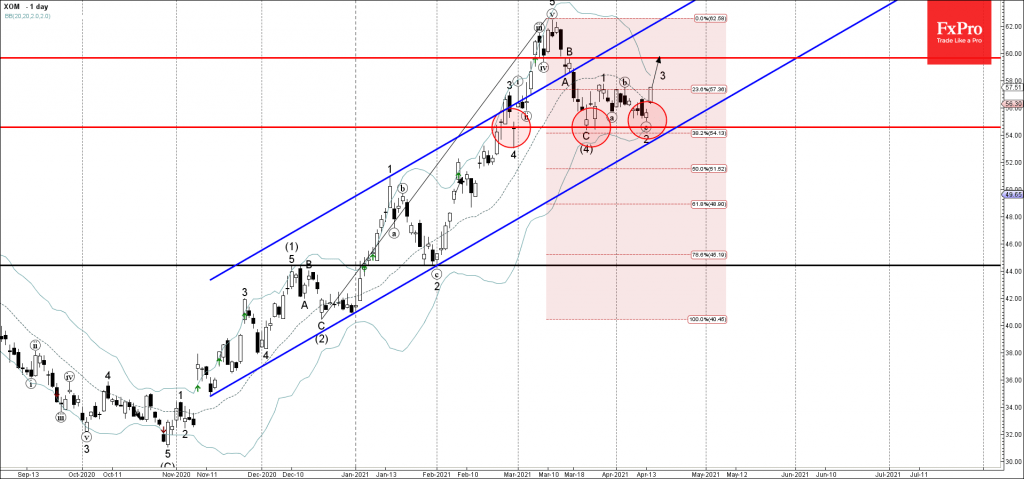
April 14, 2021 @ 18:00 +03:00
• Exxon reversed from support zone
• Likely to rise to resistance level 60.00
Exxon recently reversed up from the support zone set between the key support level 54.55 (which has been reversing the price from February), lower daily Bollinger Band and the 38.2% Fibonacci retracement of the previous sharp upward impulse (3) from December.
This support zone was further strengthened by the support trendline of the daily up channel from last November.
Exxon is likely to rise in the active impulse wave 3 toward the next resistance level 60.00 (top of the previous minor correction B from the middle of March).
Related Articles

WTI crude oil Wave Analysis 23 April 2024
April 23, 2024 @ 22:47 +03:00

USDCAD Wave Analysis 23 April 2024
April 23, 2024 @ 22:46 +03:00

Intel Wave Analysis 19 April 2024
April 19, 2024 @ 22:12 +03:00

GBPUSD Wave Analysis 19 April 2024
April 19, 2024 @ 22:11 +03:00