

Technical analysis
EURGBP Wave Analysis – 16 August, 2019
August 16, 2019 @ 15:19 +03:00

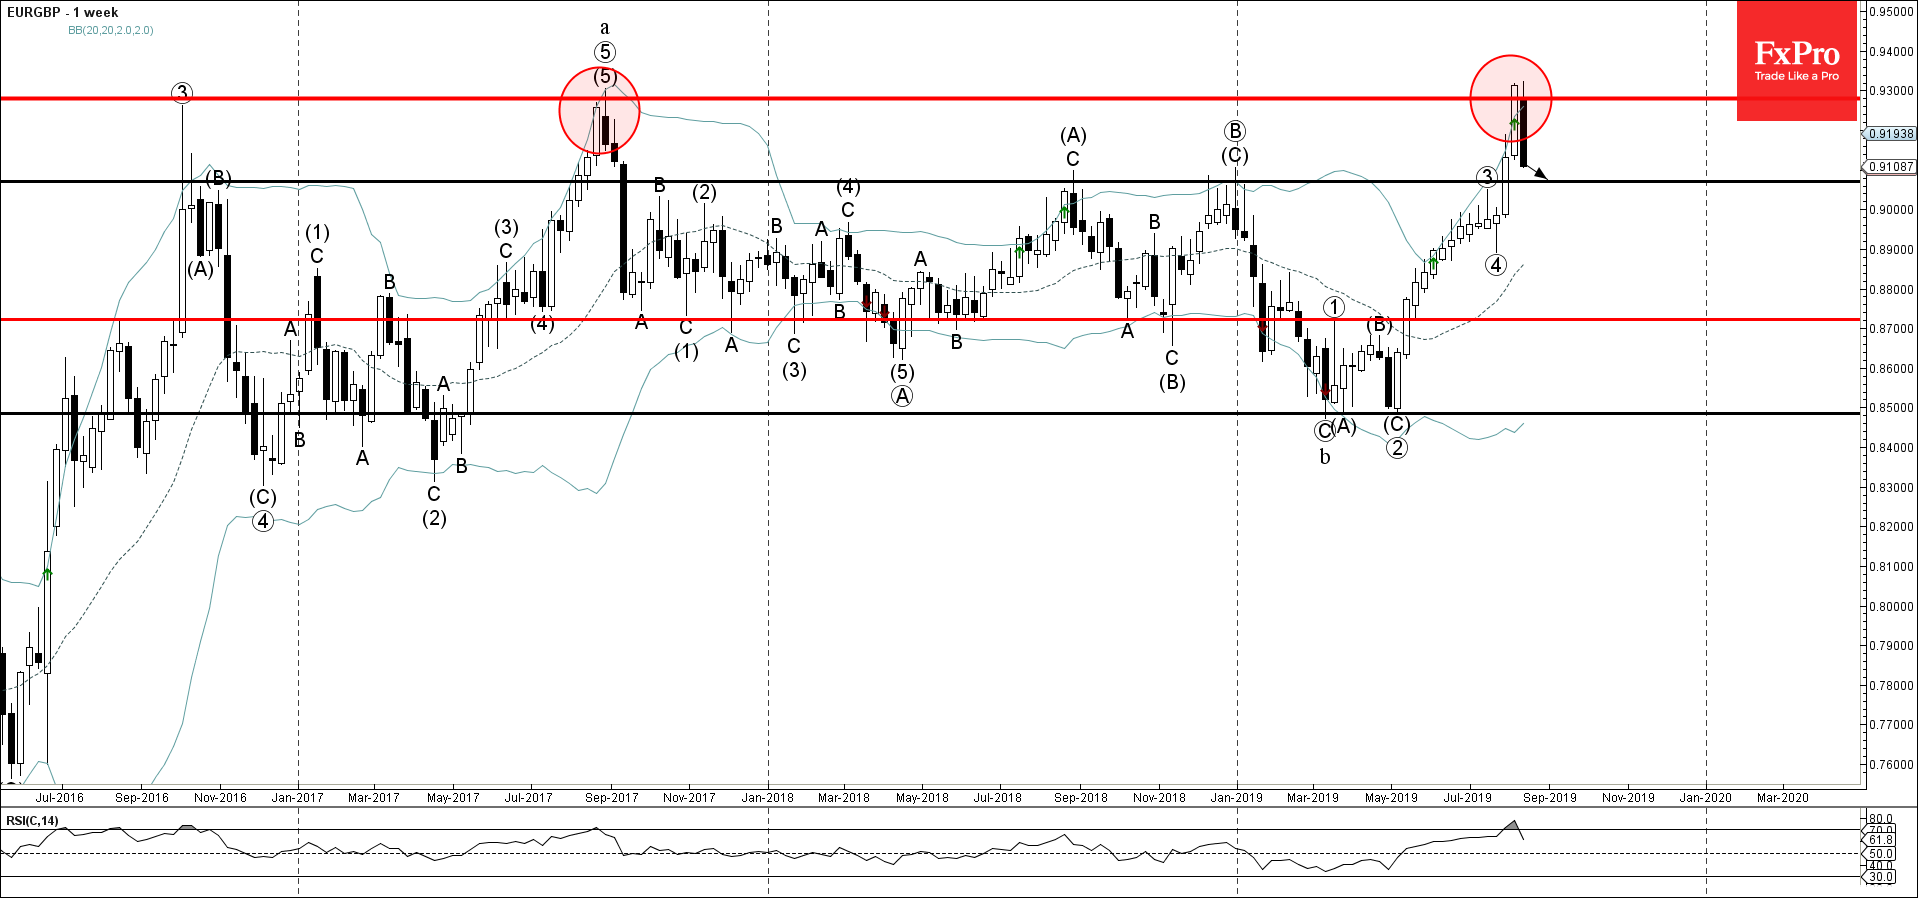
- EURGBP reversed from resistance area
- Further losses are likely
EURGBP previously reversed down precisely from the resistance area lying between the multi-year resistance level 0.9300 (which has been reversing the price from 2016) and the upper weekly Bollinger Band.
If the price closes this week near the active levels it will form the weekly Japanese candlesticks reversal pattern Bearish Engulfing.
EURGBP is expected to fall further and retest the next support level 0.9070 (former strong resistance from 2018).
Related Articles

Intel Wave Analysis 19 April 2024
April 19, 2024 @ 22:12 +03:00

GBPUSD Wave Analysis 19 April 2024
April 19, 2024 @ 22:11 +03:00

EURJPY Wave Analysis 18 April 2024
April 18, 2024 @ 23:09 +03:00

EURUSD Wave Analysis 18 April 2024
April 18, 2024 @ 23:08 +03:00