

Technical analysis
EURCHF Wave Analysis 6 October, 2020
October 06, 2020 @ 17:35 +03:00

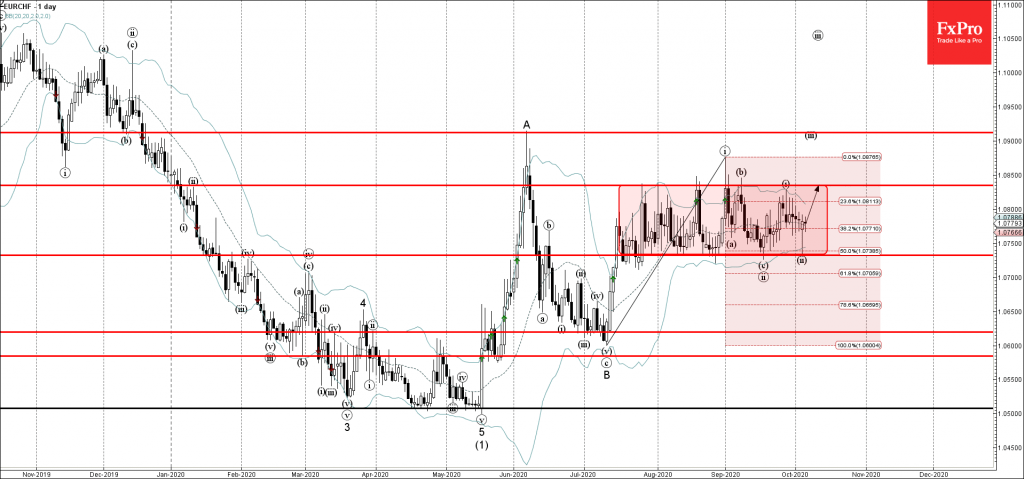
• EURCHF reversed from support area
• Likely to rise to 1,0835
EURCHF recently reversed up from the support zone lying between the support level 1,0730 (lower boundary of the tight sideways price range from July), lower daily Bollinger Band and the 50% Fibonacci correction of the upward impulse from July.
The upward reversal from the aforementioned support zone created the daily Japanese candlesticks reversal pattern Hammer.
EURCHF price is likely to rise further toward the next resistance level 1,0835 (top of the active sideways price range).
Related Articles

EURJPY Wave Analysis 18 April 2024
April 18, 2024 @ 23:09 +03:00

EURUSD Wave Analysis 18 April 2024
April 18, 2024 @ 23:08 +03:00

WTI Wave Analysis 17 April 2024
April 17, 2024 @ 22:40 +03:00

EURGBP Wave Analysis 17 April 2024
April 17, 2024 @ 22:38 +03:00