

Technical analysis
Cotton Wave Analysis 22 December, 2020
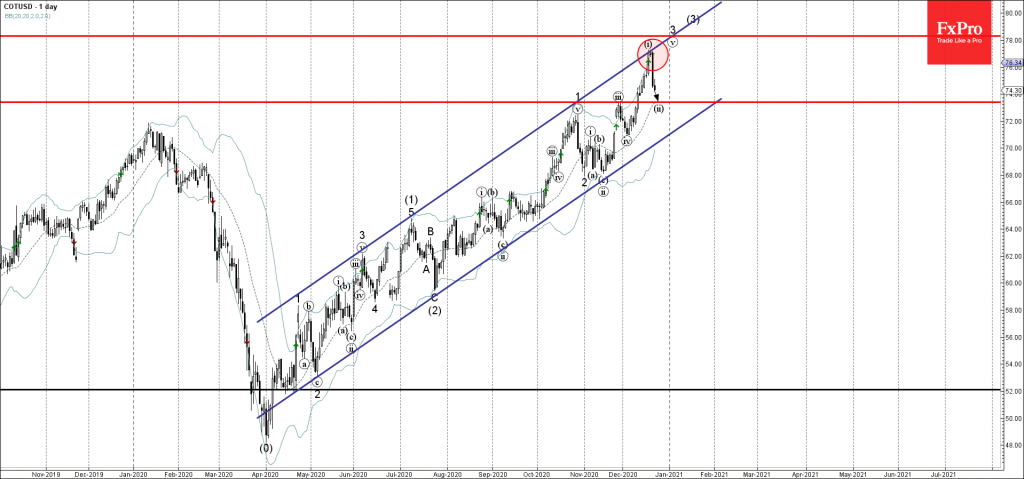
December 22, 2020 @ 18:30 +03:00

• Cotton reversed from resistance area
• Likely to fall to 73.40
Cotton recently reversed down sharply from the resistance area lying between the resistance trendline of the daily up channel from March and the upper daily Bollinger Band.
The downward reversal from this resistance area created the daily Japanese candlesticks pattern Evening Star Doji.
Cotton is expected fall further toward the next support level 73.40 (former monthly high from November and the target price for the completion of the active wave (ii)).
Related Articles

EURGBP Wave Analysis 24 April 2024
April 24, 2024 @ 21:42 +03:00

EURJPY Wave Analysis 24 April 2024
April 24, 2024 @ 21:40 +03:00

WTI crude oil Wave Analysis 23 April 2024
April 23, 2024 @ 22:47 +03:00

USDCAD Wave Analysis 23 April 2024
April 23, 2024 @ 22:46 +03:00