

Technical analysis
Cotton Wave Analysis – 14 October, 2019
October 14, 2019 @ 16:43 +03:00

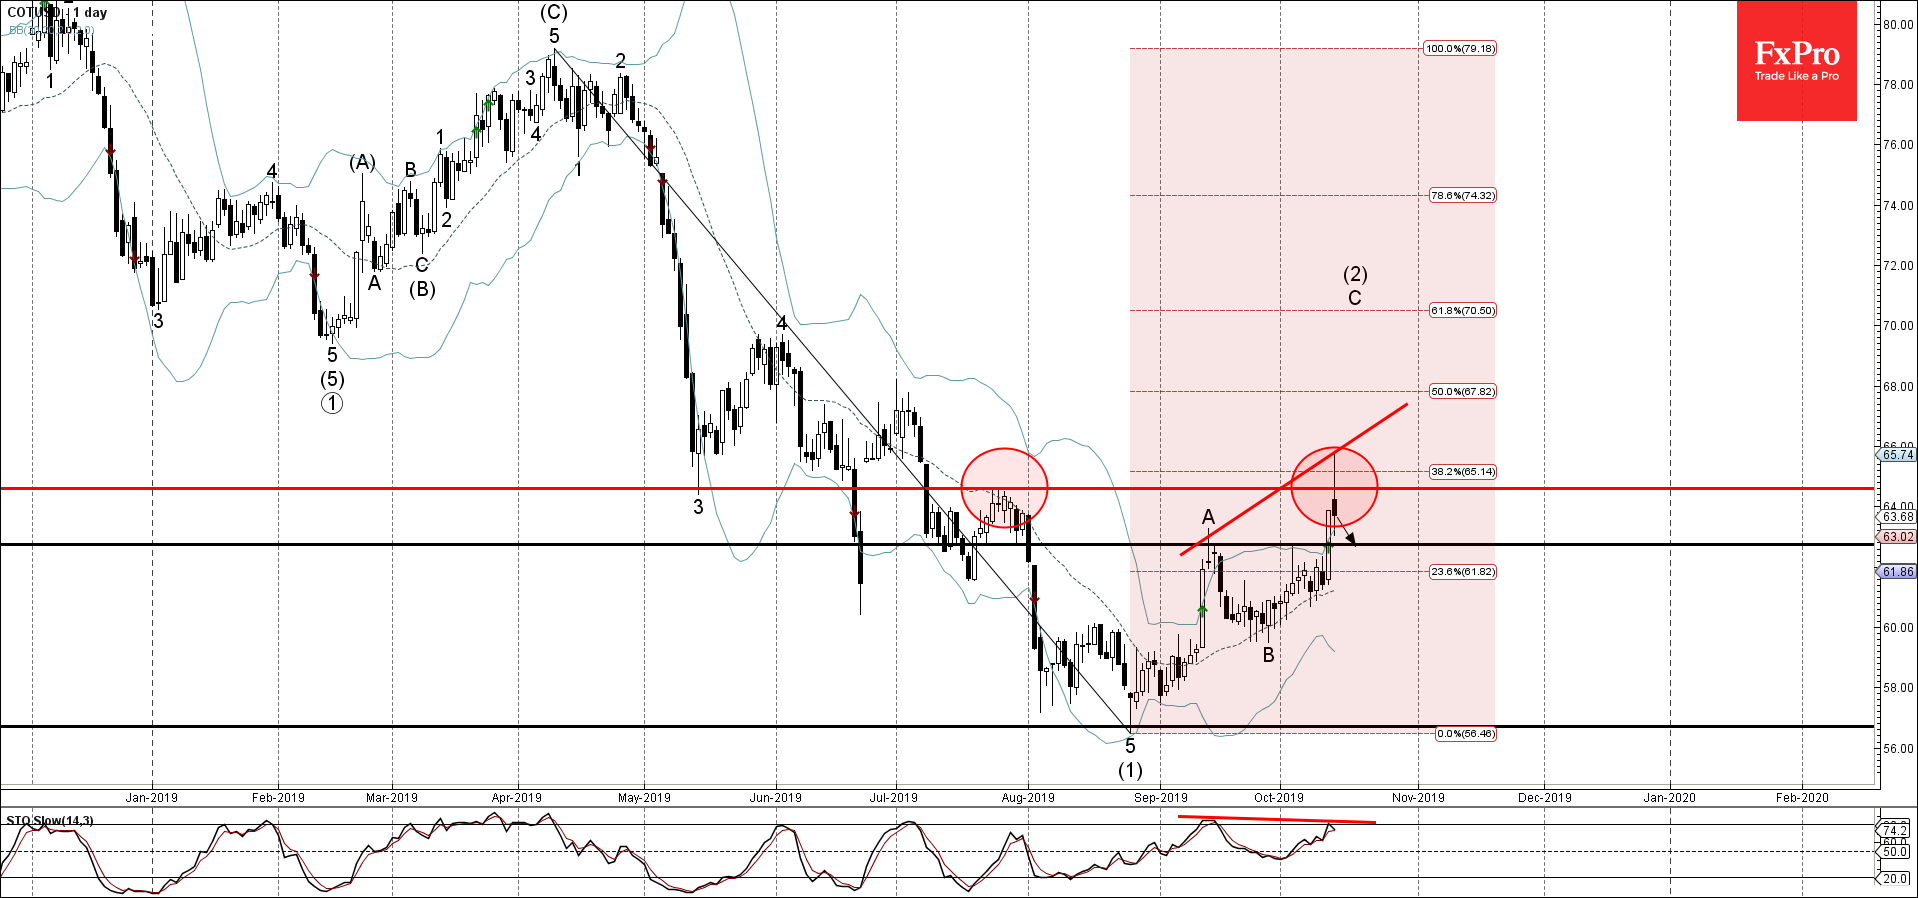
- Cotton reversed from resistance zone
- Likely to fall to 62.70
Cotton today reversed down from the resistance area located between the resistance level 64.60 (which reversed the price in July), upper daily Bollinger Band and the 38.2% Fibonacci correction of the previous downward impulse from April.
The downward reversal from this resistance zone stopped the earlier short-term impulse wave C of the ABC correction (2) from August.
Given the clear bearish divergence on the daily Stochastic indicator – Cotton is expected to fall further and retest the next support level 62.70.
Related Articles

WTI Wave Analysis 17 April 2024
April 17, 2024 @ 22:40 +03:00

EURGBP Wave Analysis 17 April 2024
April 17, 2024 @ 22:38 +03:00

Citigroup Wave Analysis 16 April 2024
April 16, 2024 @ 22:06 +03:00

USDJPY Wave Analysis 16 April 2024
April 16, 2024 @ 22:05 +03:00