

Technical analysis
Costco Wave Analysis – 10 October, 2019
October 10, 2019 @ 15:57 +03:00

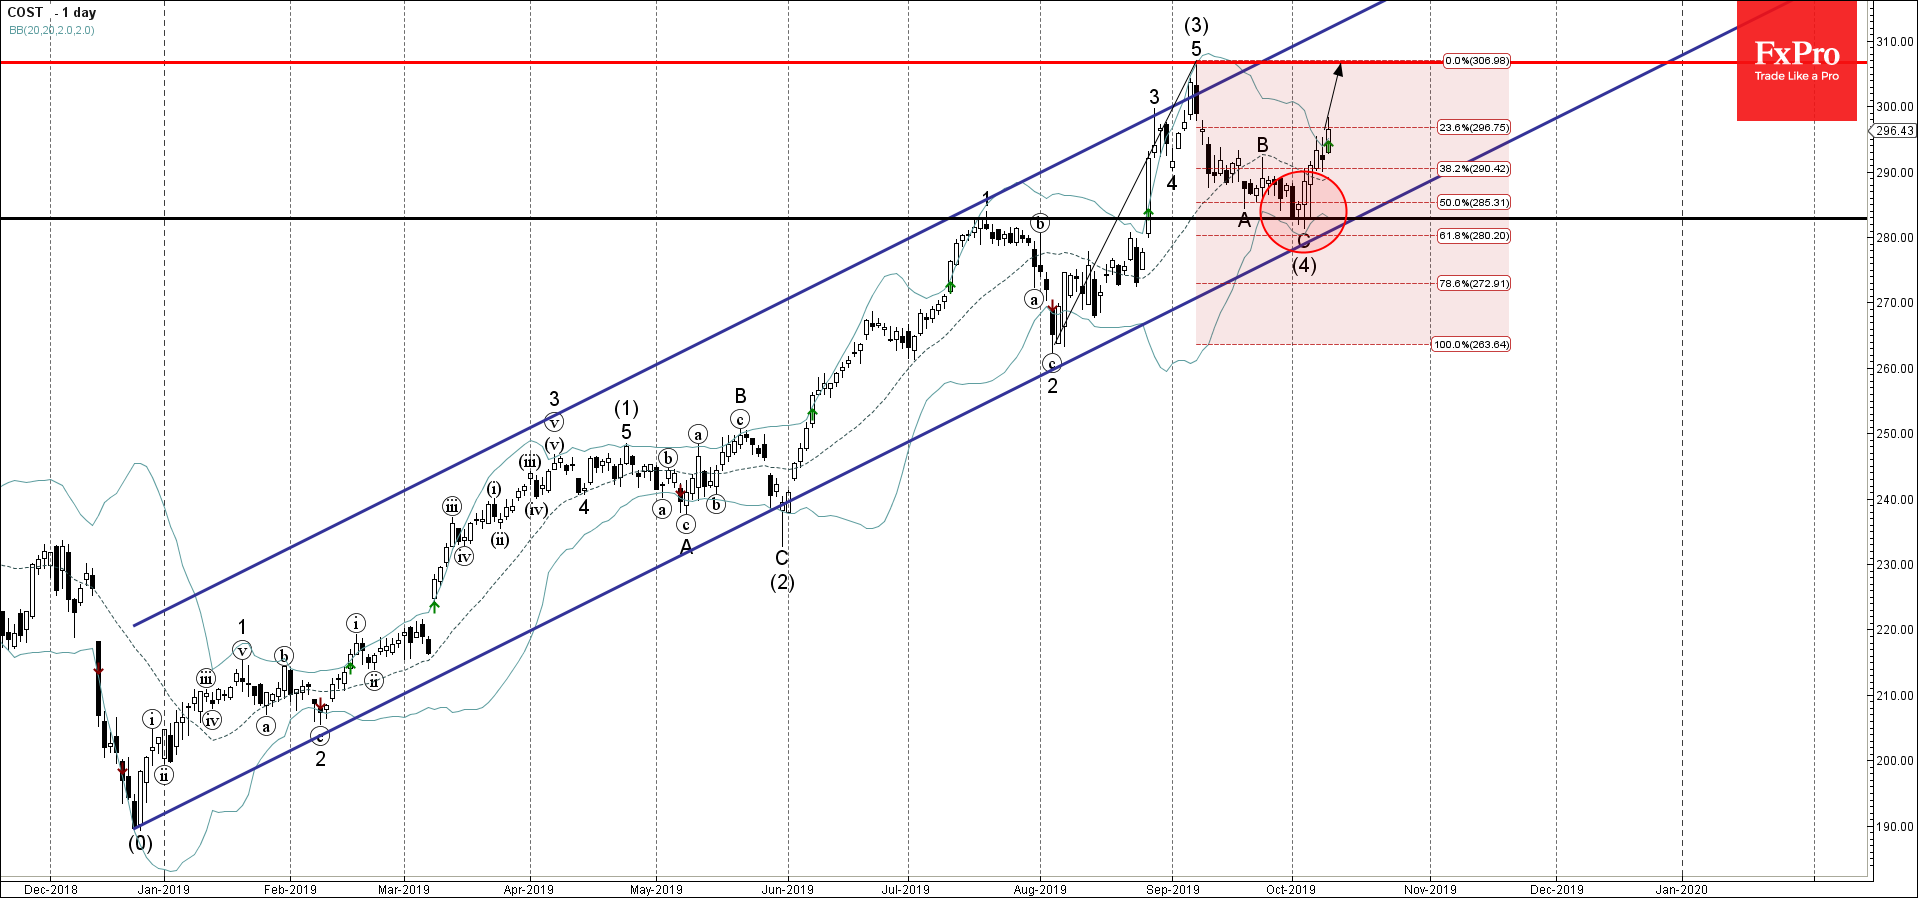
- Costco reversed from support zone
- Likely to rise to 306.00
Costco recently reversed up from the support zone lying between the pivotal support level 282.00 (former monthly high from July), lower daily Bollinger Band and the 50% Fibonacci correction of the pervious sharp upward impulse from August.
The upward reversal from this support zone created the daily Morning Star which started the active impulse wave (5).
Costco is expected to rise further and retest the next resistance level 306.00 (top of the pervious upward impulse wave (3)).
Related Articles

Intel Wave Analysis 19 April 2024
April 19, 2024 @ 22:12 +03:00

GBPUSD Wave Analysis 19 April 2024
April 19, 2024 @ 22:11 +03:00

EURJPY Wave Analysis 18 April 2024
April 18, 2024 @ 23:09 +03:00

EURUSD Wave Analysis 18 April 2024
April 18, 2024 @ 23:08 +03:00