

Technical analysis
Copper Wave Analysis – 10 September, 2019
September 10, 2019 @ 16:53 +03:00

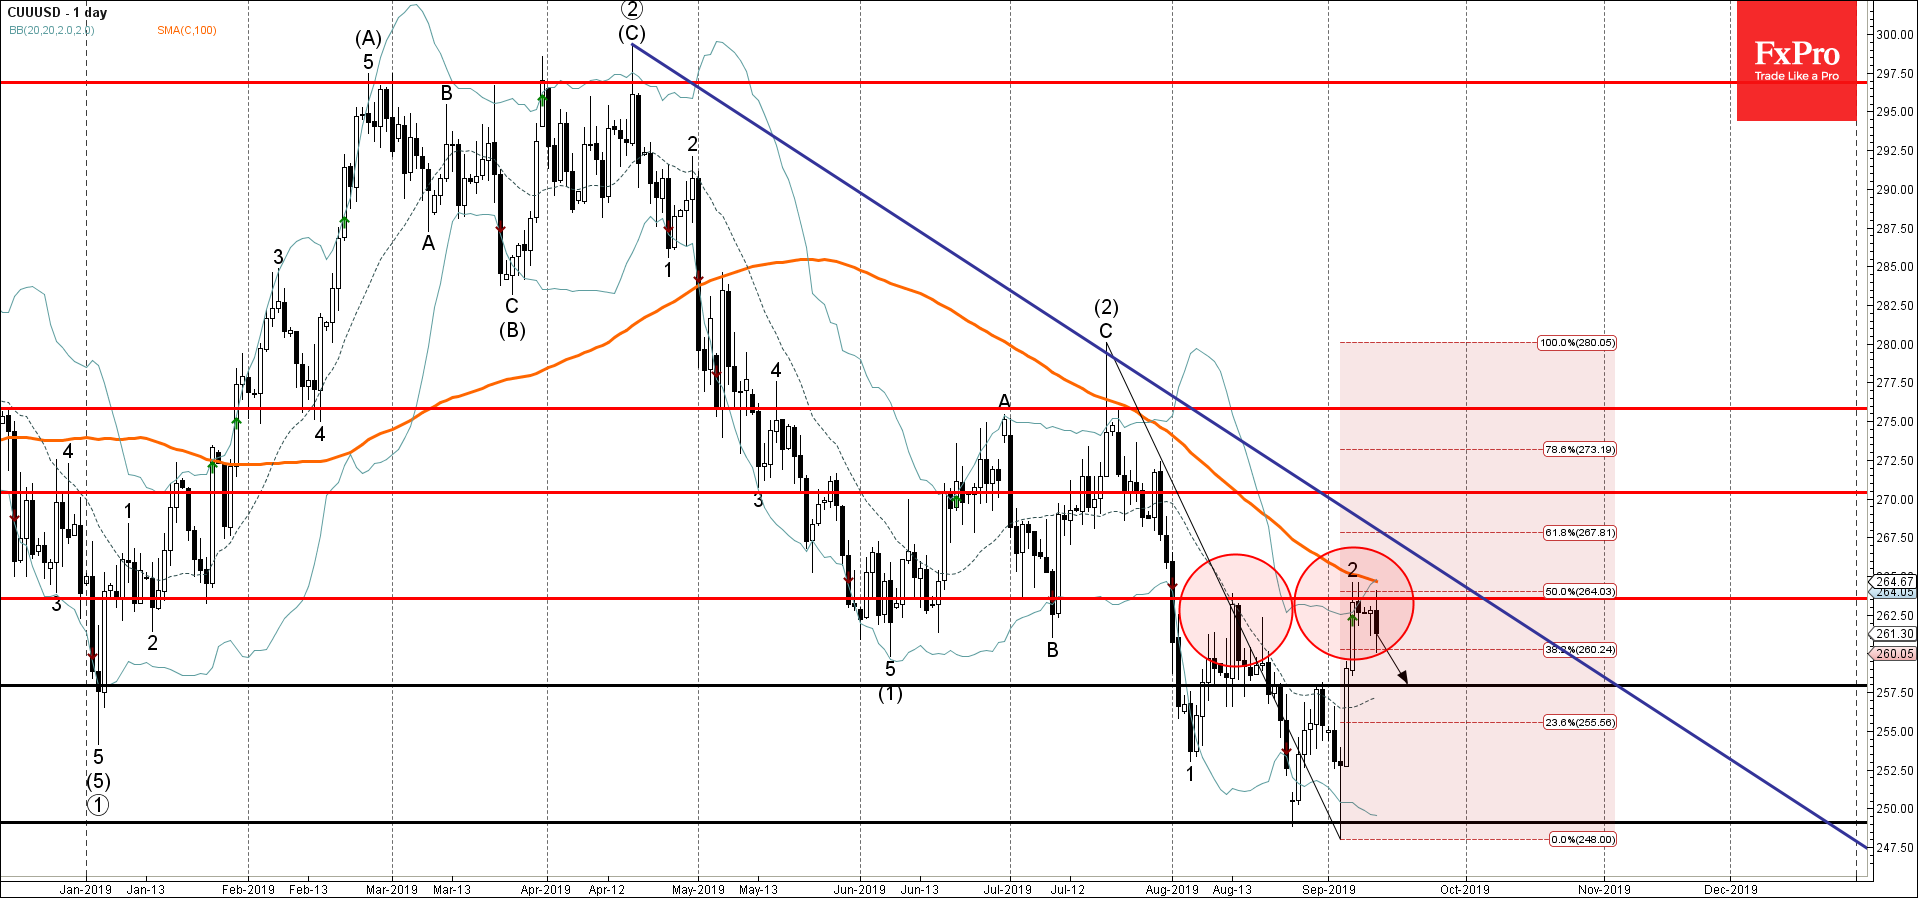
- Copper reversed from resistance area
- Further losses are likely
Copper recently reversed down from the resistance area lying between the key resistance level 264.00 (former monthly high from April), upper daily Bollinger Band, 100-day moving average and the 50% Fibonacci correction of the previous downward impulse from July.
The downward reversal from this the resistance area started the active short-term impulse wave 3 – which belongs to the medium-term impulse wave (3) from July.
Copper is expected to fall further and retest the next support level 257.50 (former resistance from August).
Related Articles

EURJPY Wave Analysis 18 April 2024
April 18, 2024 @ 23:09 +03:00

EURUSD Wave Analysis 18 April 2024
April 18, 2024 @ 23:08 +03:00

WTI Wave Analysis 17 April 2024
April 17, 2024 @ 22:40 +03:00

EURGBP Wave Analysis 17 April 2024
April 17, 2024 @ 22:38 +03:00