

Technical analysis
Copper Wave Analysis – 05 December, 2019
December 05, 2019 @ 17:21 +03:00

- Copper reversed from support area
- Likely to rise to 270,00
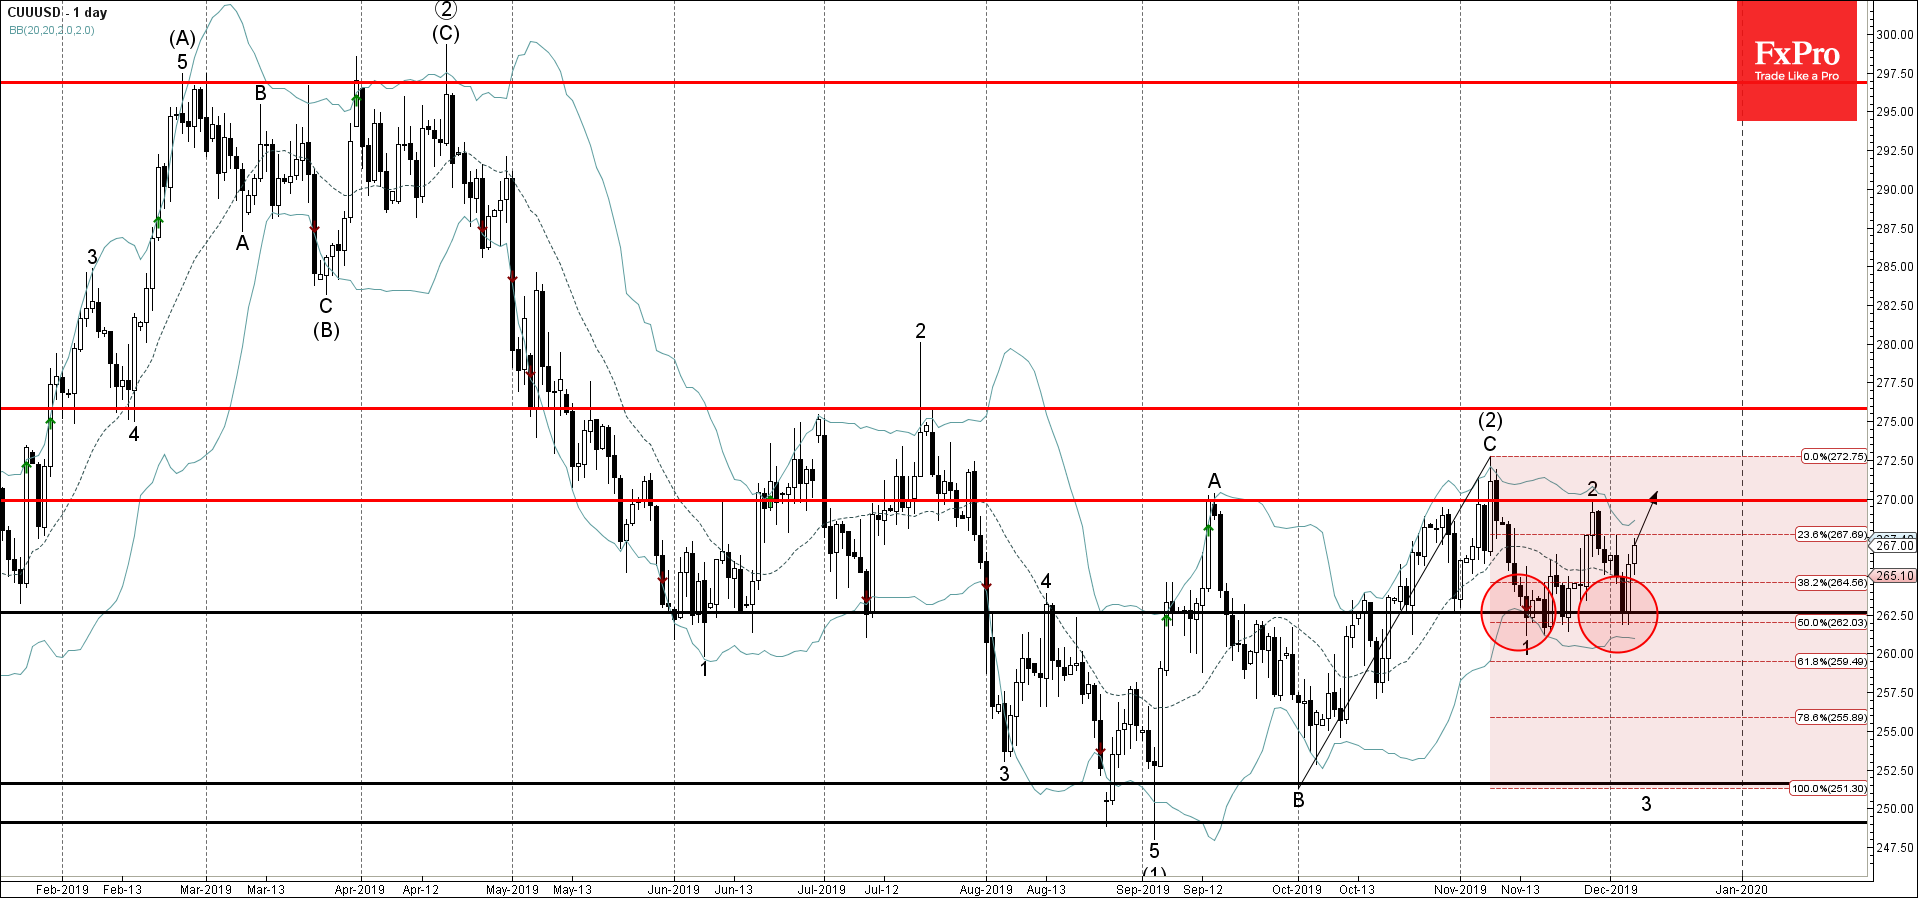
Copper recently reversed up from the support area lying between the support level 262,50 (which has been reversing the price from October), lower daily Bollinger Band and the 50% Fibonacci correction of the previous sharp upward impulse C from October.
The upward reversal from this support area created the daily Japanese candlesticks reversal pattern Bullish Engulfing. .
Copper is expected to rise further toward the next resistance level 270,00 (top of the previous wave 2).
Related Articles

Citigroup Wave Analysis 16 April 2024
April 16, 2024 @ 22:06 +03:00

USDJPY Wave Analysis 16 April 2024
April 16, 2024 @ 22:05 +03:00

S&P 500 Wave Analysis 15 April 2024
April 16, 2024 @ 00:44 +03:00

EURUSD Wave Analysis 15 April 2024
April 16, 2024 @ 00:44 +03:00