

Comcast Wave Analysis 13 April, 2021
April 13, 2021 @ 18:03 +03:00

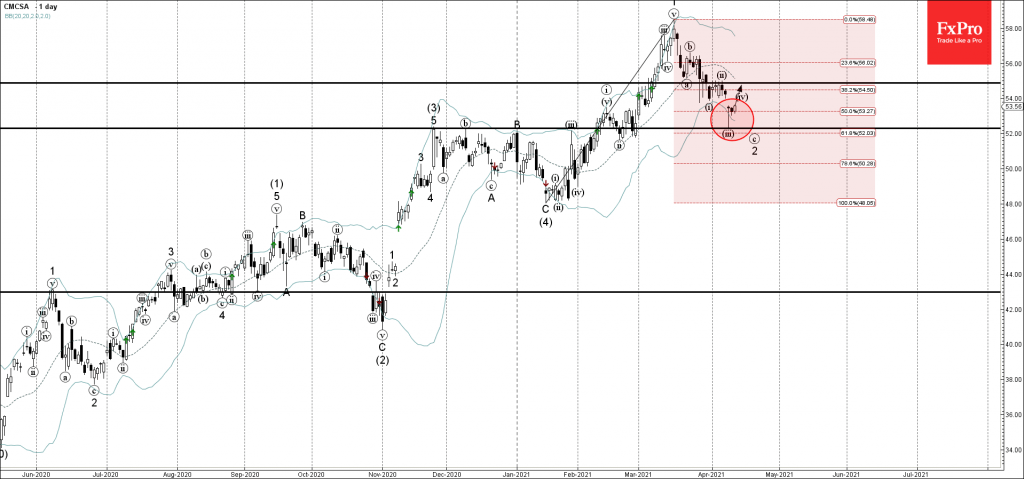
• Comcast reversed from support zone
• Likely to reach resistance level 54.90
Comcast recently reversed up with the daily Hammer from the support zone lying between the key support level 52.30 (former resistance from November and December), lower daily Bollinger Band and the 61.8% Fibonacci correction of the previous upward impulse 1 from January.
The upward reversal from this support zone started the active short-term corrective wave (iv).
Given the predominant uptrend – Comcast is likely to rise further toward the next resistance level 54.90 (top of the previous minor corrective wave (ii) from the start of April).

April 19, 2024 @ 22:12 +03:00

April 19, 2024 @ 22:11 +03:00

April 18, 2024 @ 23:09 +03:00

April 18, 2024 @ 23:08 +03:00