

Technical analysis
CADCHF Wave Analysis – 30 October, 2019
October 30, 2019 @ 12:48 +03:00

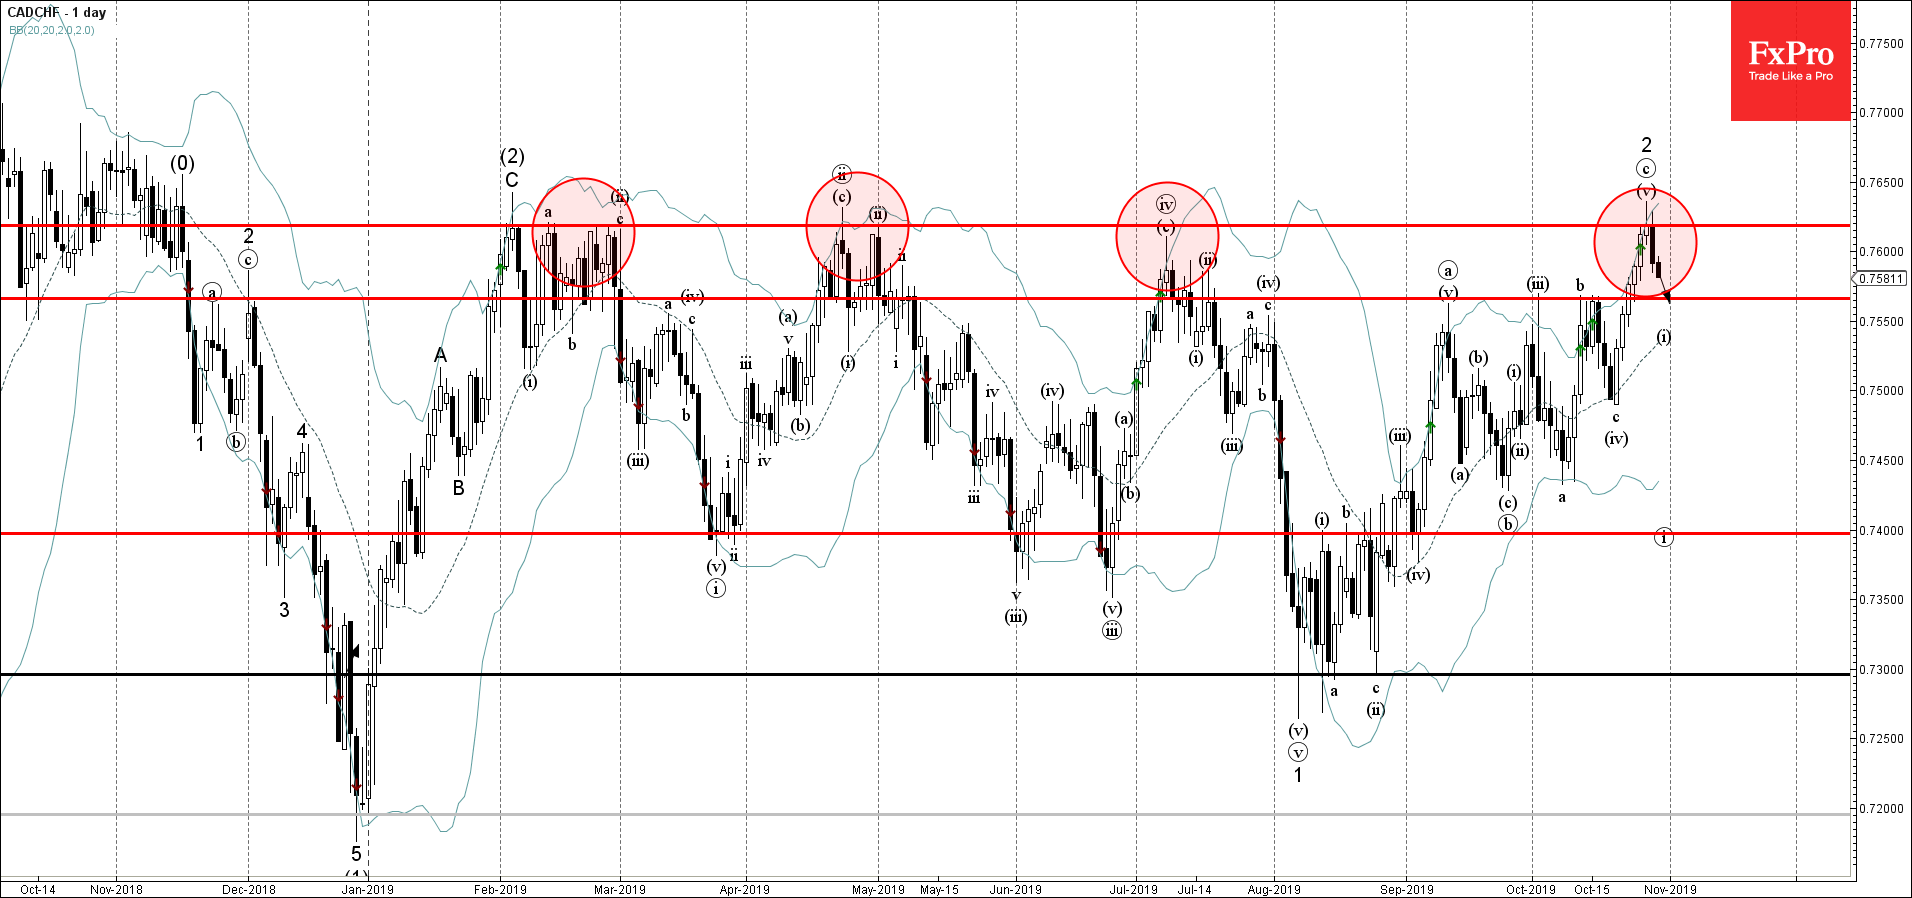
- CADCHF reversed from strong resistance zone
- Likely to fall to 0.7570
CADCHF recently reversed down from resistance zone located between the multi-month resistance level 0.7620 (which has been reversing the price from February) and the upper daily Bollinger Band.
The downward reversal from this resistance area created the daily candlesticks reversal pattern Evening Star – which stopped the earlier ABC correction 2 from August.
CADCHF is expected to fall further and retest the next support level 0.7570 (former strong resistance from September and the start of October).
Related Articles

EURJPY Wave Analysis 18 April 2024
April 18, 2024 @ 23:09 +03:00

EURUSD Wave Analysis 18 April 2024
April 18, 2024 @ 23:08 +03:00

WTI Wave Analysis 17 April 2024
April 17, 2024 @ 22:40 +03:00

EURGBP Wave Analysis 17 April 2024
April 17, 2024 @ 22:38 +03:00