

Technical analysis
AT&T Wave Analysis – 31 January, 2020
January 31, 2020 @ 16:28 +03:00

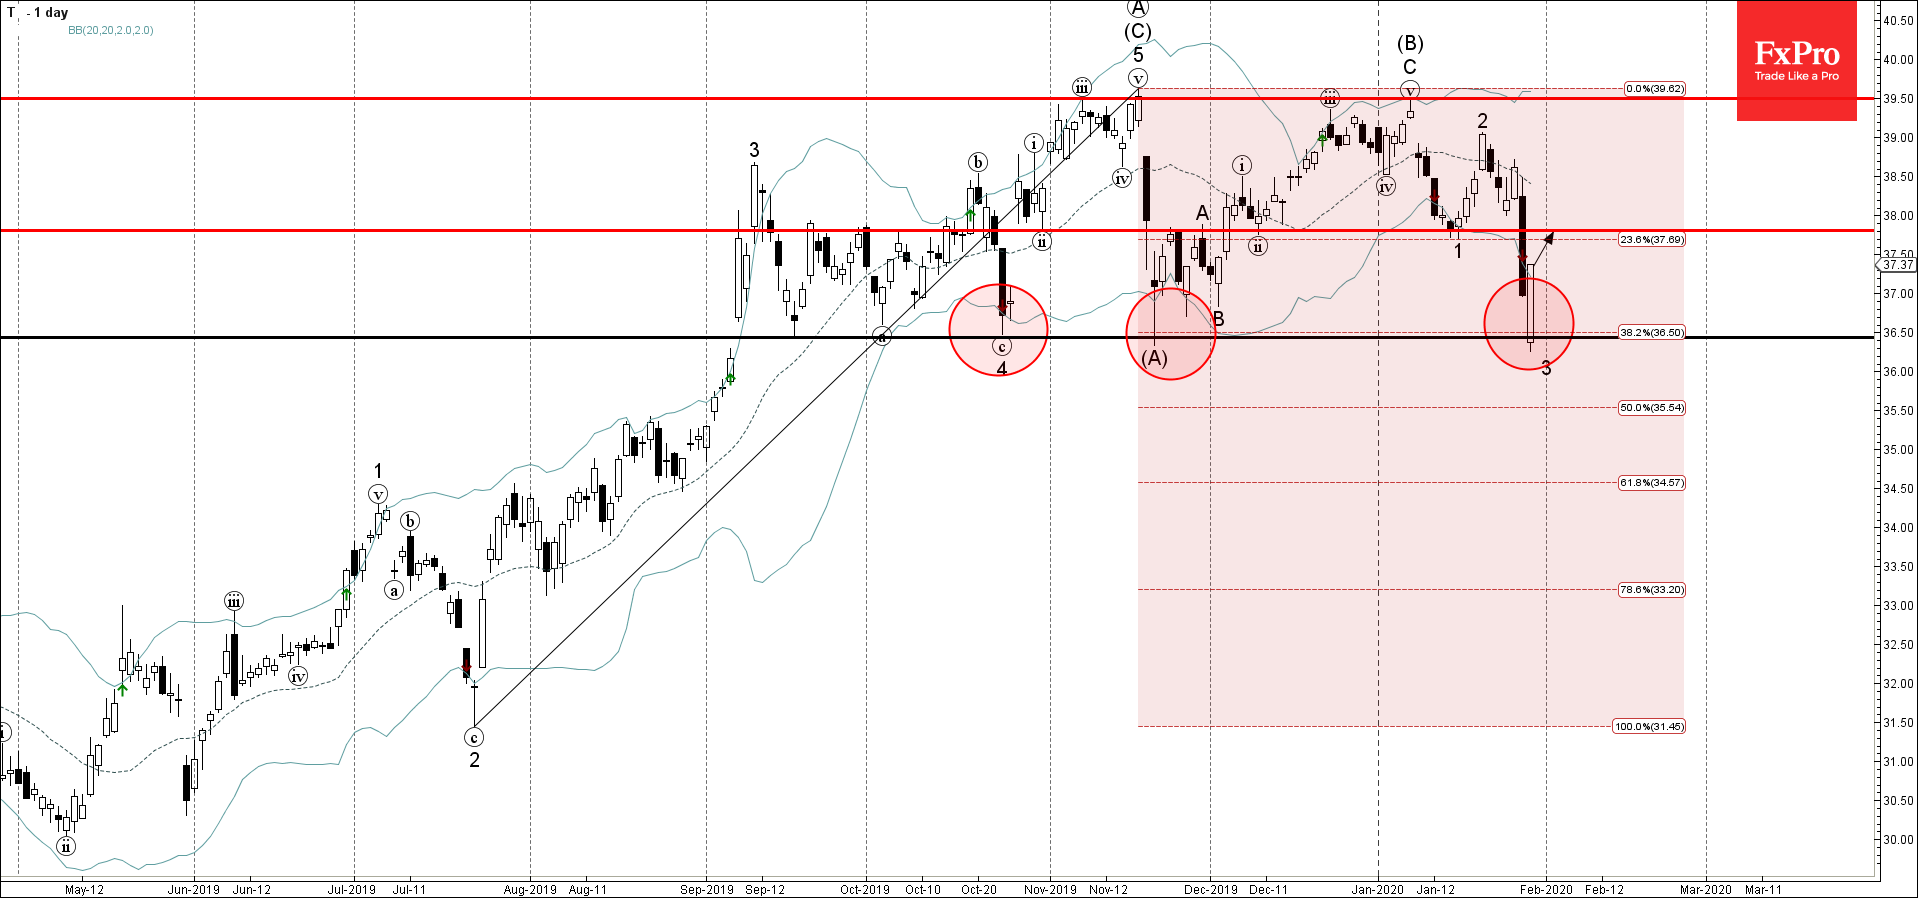
- AT&T reversed from support area
- Likely to rise to 37.80
AT&T recently reversed up sharply from support area lying between the key support level 36.5 (which has been reversing the price from September), 38.2% Fibonacci correction of the earlier upward impulse from July and the lower daily Bollinger Band.
The upward reversal from this support area stopped the earlier short-term impulse wave 3.
AT&T is likely to rise further toward the next resistance level 37.80 (low of the previous impulse wave 1 from the middle of January).
Related Articles

EURJPY Wave Analysis 18 April 2024
April 18, 2024 @ 23:09 +03:00

EURUSD Wave Analysis 18 April 2024
April 18, 2024 @ 23:08 +03:00

WTI Wave Analysis 17 April 2024
April 17, 2024 @ 22:40 +03:00

EURGBP Wave Analysis 17 April 2024
April 17, 2024 @ 22:38 +03:00