Categories: Technical analysis

WTI Wave Analysis – 9 November, 2022

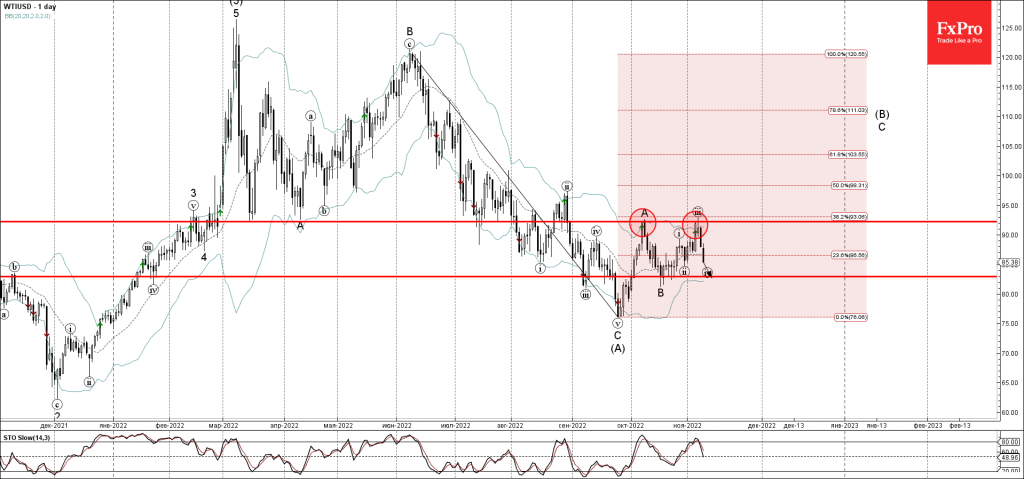
• WTI reversed from resistance 92.25

• Likely to fall to support level 82.90

WTI crude oil recently reversed down from the pivotal resistance 92.25 (previous monthly high and top of wave A from October) – intersecting with the upper daily Bollinger Band and the 38.2% Fibonacci correction of the downward impulse from June.

The downward reversal from the resistance 92.25 started the active short-term correction (iv) – which belongs to the higher order impulse wave C from October.

WTI crude oil can be expected to fall further toward the next support level 82.90 (low of the previous wave B and the target for the end of the active correction (iv)).

The FxPro Tech Analysis Team

The FxPro technical experts prepare a daily analysis of the most active currency pairs (majors, crosses, exotics) and commodities. Selected instruments are reviewed on daily trends (D1, H4), using the active Elliott Wave setups, Japanese candlesticks, indicators, and support/resistance levels.

Share
Published by
The FxPro Tech Analysis Team
Tags: wti

Recent Posts

Oil Bounces Locally, Global Support 5% below Spot Price 

The number of operating oil rigs in the US fell by 7 to 499. This…

2 hours ago

Crypto Market Tries to Break Local Downtrend

Market picture  Crypto market capitalisation has been up 2% over the past seven days and…

9 hours ago

Adobe Wave Analysis 3 May 2024

- Adobe reversed from support zone - Likely to rise to resistance level 500.00 Adobe…

3 days ago

EURGBP Wave Analysis 3 May 2024

- EURGBP reversed from support zone - Likely to rise to resistance level 0.8625 EURGBP…

3 days ago

How Low Can the USDJPY Go?

USDJPY was slipping below 153 on Friday morning, a three-week low and having lost over…

3 days ago

Bitcoin’s Downtrend, Solana and Ethereum Form Double Bottom

Market picture  Crypto market capitalisation rose 3.3% in 24 hours to $2.22 trillion. Local capitalisation…

3 days ago

This website uses cookies