Categories: Technical analysis

USDCHF Wave Analysis 23 September, 2020

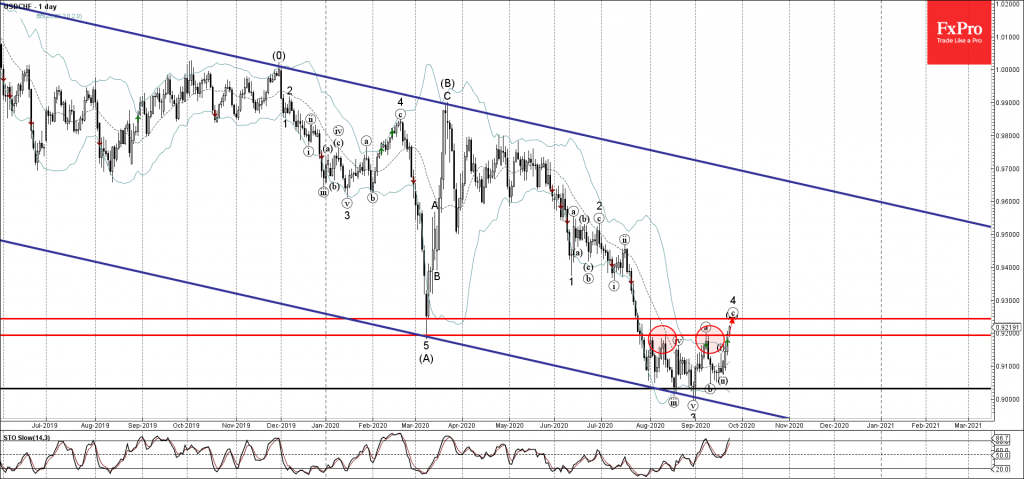
• USDCHF broke resistance level 0.9200

• Likely to rise to 0.9240

USDCHF recently broke the key resistance level 0.9200 (which stopped the previous short-term corrective wave (a) at the start of September, as can be seen below).

The breakout of the resistance level 0.9200 accelerated the active short-term corrective wave 4.

USDCHF is expected to rise further and re-test the next resistance level 0.9240 (target price for the completion of the active corrective wave 4).

The FxPro Tech Analysis Team

The FxPro technical experts prepare a daily analysis of the most active currency pairs (majors, crosses, exotics) and commodities. Selected instruments are reviewed on daily trends (D1, H4), using the active Elliott Wave setups, Japanese candlesticks, indicators, and support/resistance levels.

Share
Published by
The FxPro Tech Analysis Team
Tags: USDCHF

Recent Posts

Adobe Wave Analysis 3 May 2024

- Adobe reversed from support zone - Likely to rise to resistance level 500.00 Adobe…

1 hour ago

EURGBP Wave Analysis 3 May 2024

- EURJPY reversed from support zone - Likely to rise to resistance level 0.8625 EURGBP…

1 hour ago

How Low Can the USDJPY Go?

USDJPY was slipping below 153 on Friday morning, a three-week low and having lost over…

8 hours ago

Bitcoin’s Downtrend, Solana and Ethereum Form Double Bottom

Market picture  Crypto market capitalisation rose 3.3% in 24 hours to $2.22 trillion. Local capitalisation…

14 hours ago

EURJPY Wave Analysis 2 May 2024

- EURJPY under strong bearish pressure - Likely to fall to support level 163.10 EURJPY…

1 day ago

WTI crude oil Wave Analysis 2 May 2024

- WTI broke round support level 80.00 - Likely to fall to support level 76.00…

1 day ago

This website uses cookies