Categories: Technical analysis

USDCHF Wave Analysis – 15 June, 2020

• USDCHF reversed from resistance zone

• Likely to fall to 0.9400

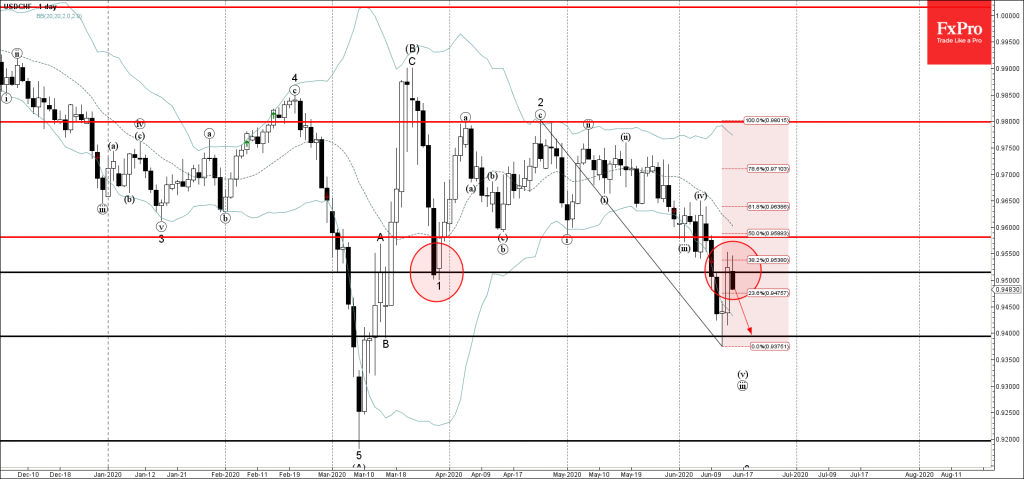
USDCHF recently reversed down from the resistance area lying between the resistance level 0.9500 (former support from the end of March) and the 38.2% Fibonacci correction of the previous downward impulse from the end of April.

The downward reversal from this resistance area is aligned with the active short-term downward impulse sequence 3 from last month.

USDCHF is likely to fall further toward the next support level 0.9400 (which created the daily Morning Star earlier this month).

The FxPro Tech Analysis Team

The FxPro technical experts prepare a daily analysis of the most active currency pairs (majors, crosses, exotics) and commodities. Selected instruments are reviewed on daily trends (D1, H4), using the active Elliott Wave setups, Japanese candlesticks, indicators, and support/resistance levels.

Share
Published by
The FxPro Tech Analysis Team
Tags: USDCHF

Recent Posts

Silver and gold recovered quickly. What’s next? 

Gold and silver have been enjoying a return to demand since early May, and buyers…

2 days ago

Toncoin catches up with XRP

Market picture  The crypto market added 2.8% in the last 24 hours to a total…

2 days ago

Adobe Wave Analysis 9 May 2024

- Adobe reversed from resistance level 500.00 - Likely to fall to support level 460.00…

3 days ago

Goldman Sachs Wave Analysis 9 May 2024

- Goldman Sachs rising inside impulse waves 3 and (3) - Likely to rise to…

3 days ago

WTI crude oil Wave Analysis 8 May 2024

- WTI crude oil reversed from support area - Likely to rise to resistance level…

4 days ago

AUDJPY Wave Analysis 8 May 2024

- AUDJPY reversed from support area - Likely to rise to resistance level 103.00 AUDJPY…

4 days ago

This website uses cookies