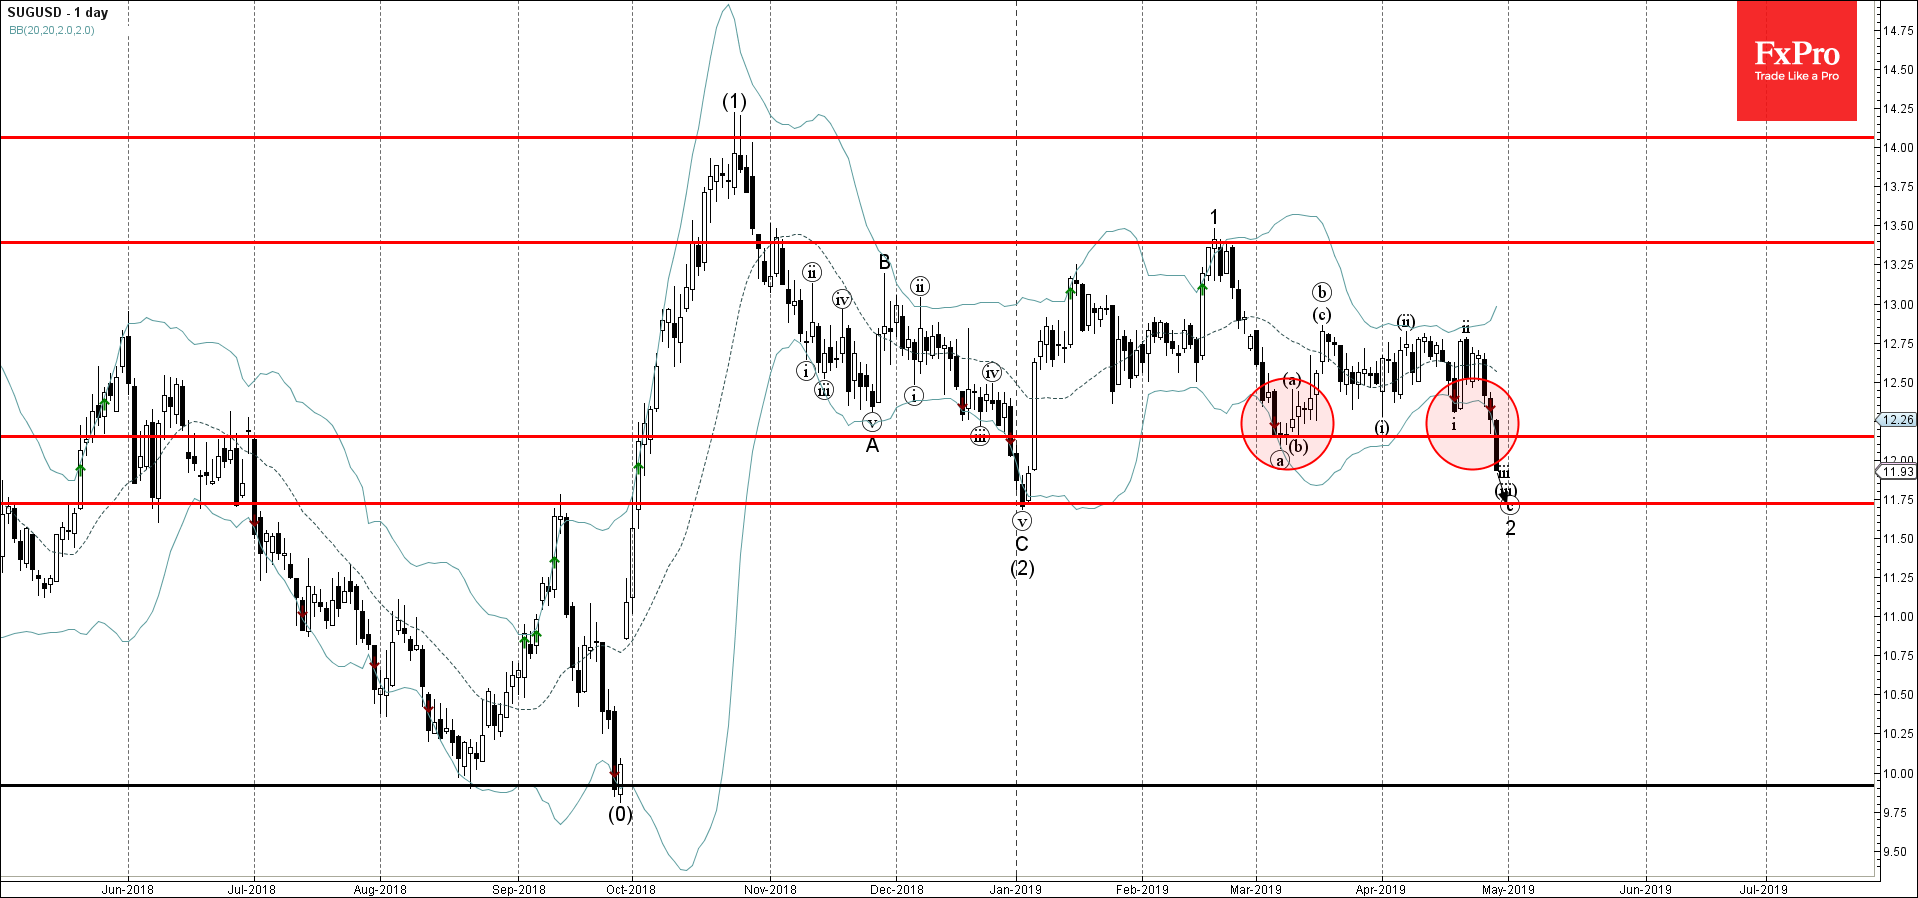
Sugar continues to fall after the recent breakout of the key support level 12.15 (which also reversed the price at the start of March).
The breakout of the support level 12.15 strengthened the bearish pressure on sugar – accelerating the active short-term ABC correction 2 from the middle of February.
Sugar is expected to fall further and re-test the next support level 11.75 (former support from January and the target for the completion of the active wave 2).
- Adobe reversed from support zone - Likely to rise to resistance level 500.00 Adobe…
- EURJPY reversed from support zone - Likely to rise to resistance level 0.8625 EURGBP…
USDJPY was slipping below 153 on Friday morning, a three-week low and having lost over…
Market picture Crypto market capitalisation rose 3.3% in 24 hours to $2.22 trillion. Local capitalisation…
- EURJPY under strong bearish pressure - Likely to fall to support level 163.10 EURJPY…
- WTI broke round support level 80.00 - Likely to fall to support level 76.00…
This website uses cookies