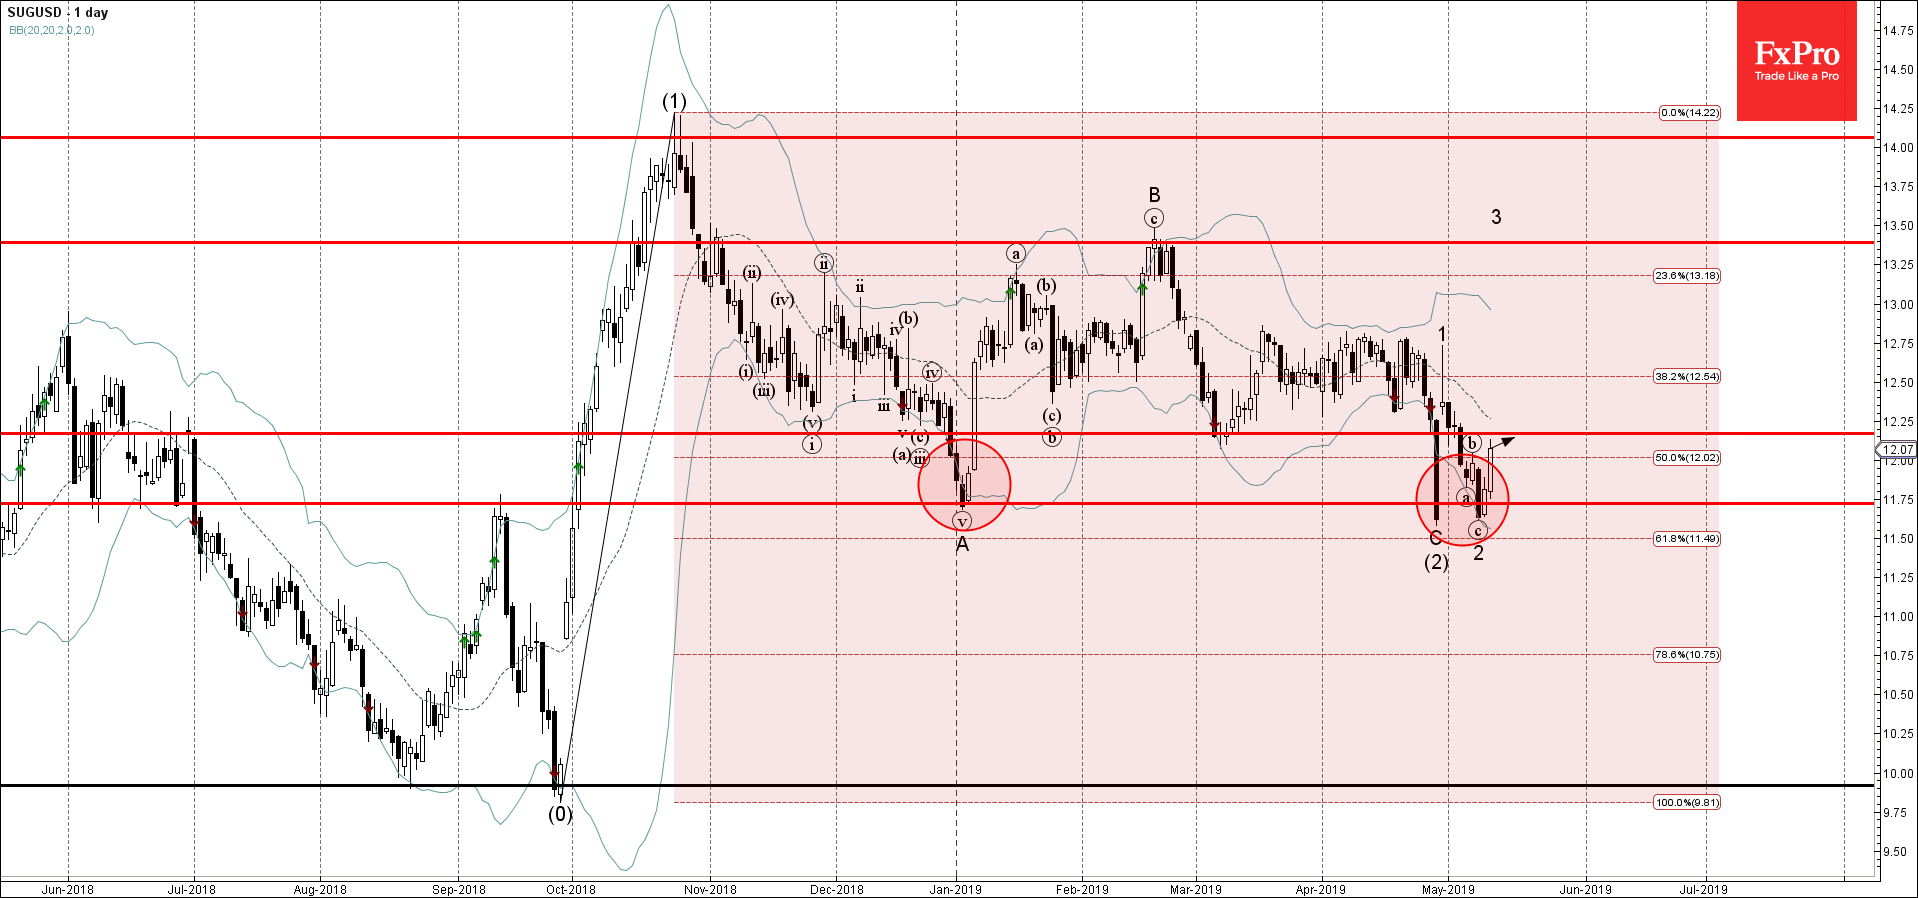
Sugar recently reversed up from the key support area lying between the support level 11.75 (which has been reversing the price from January), lower daily Bollinger Band and the 61.8% Fibonacci correction of the previous upward impulse from last September.
The upward reversal from this support area completed the previous minor ABC correction 2 – which belongs to the impulse wave (3) from April.
Sugar is expected to rise further and retest the next resistance level 12.17 (former support level from March).
- Adobe reversed from support zone - Likely to rise to resistance level 500.00 Adobe…
- EURJPY reversed from support zone - Likely to rise to resistance level 0.8625 EURGBP…
USDJPY was slipping below 153 on Friday morning, a three-week low and having lost over…
Market picture Crypto market capitalisation rose 3.3% in 24 hours to $2.22 trillion. Local capitalisation…
- EURJPY under strong bearish pressure - Likely to fall to support level 163.10 EURJPY…
- WTI broke round support level 80.00 - Likely to fall to support level 76.00…
This website uses cookies