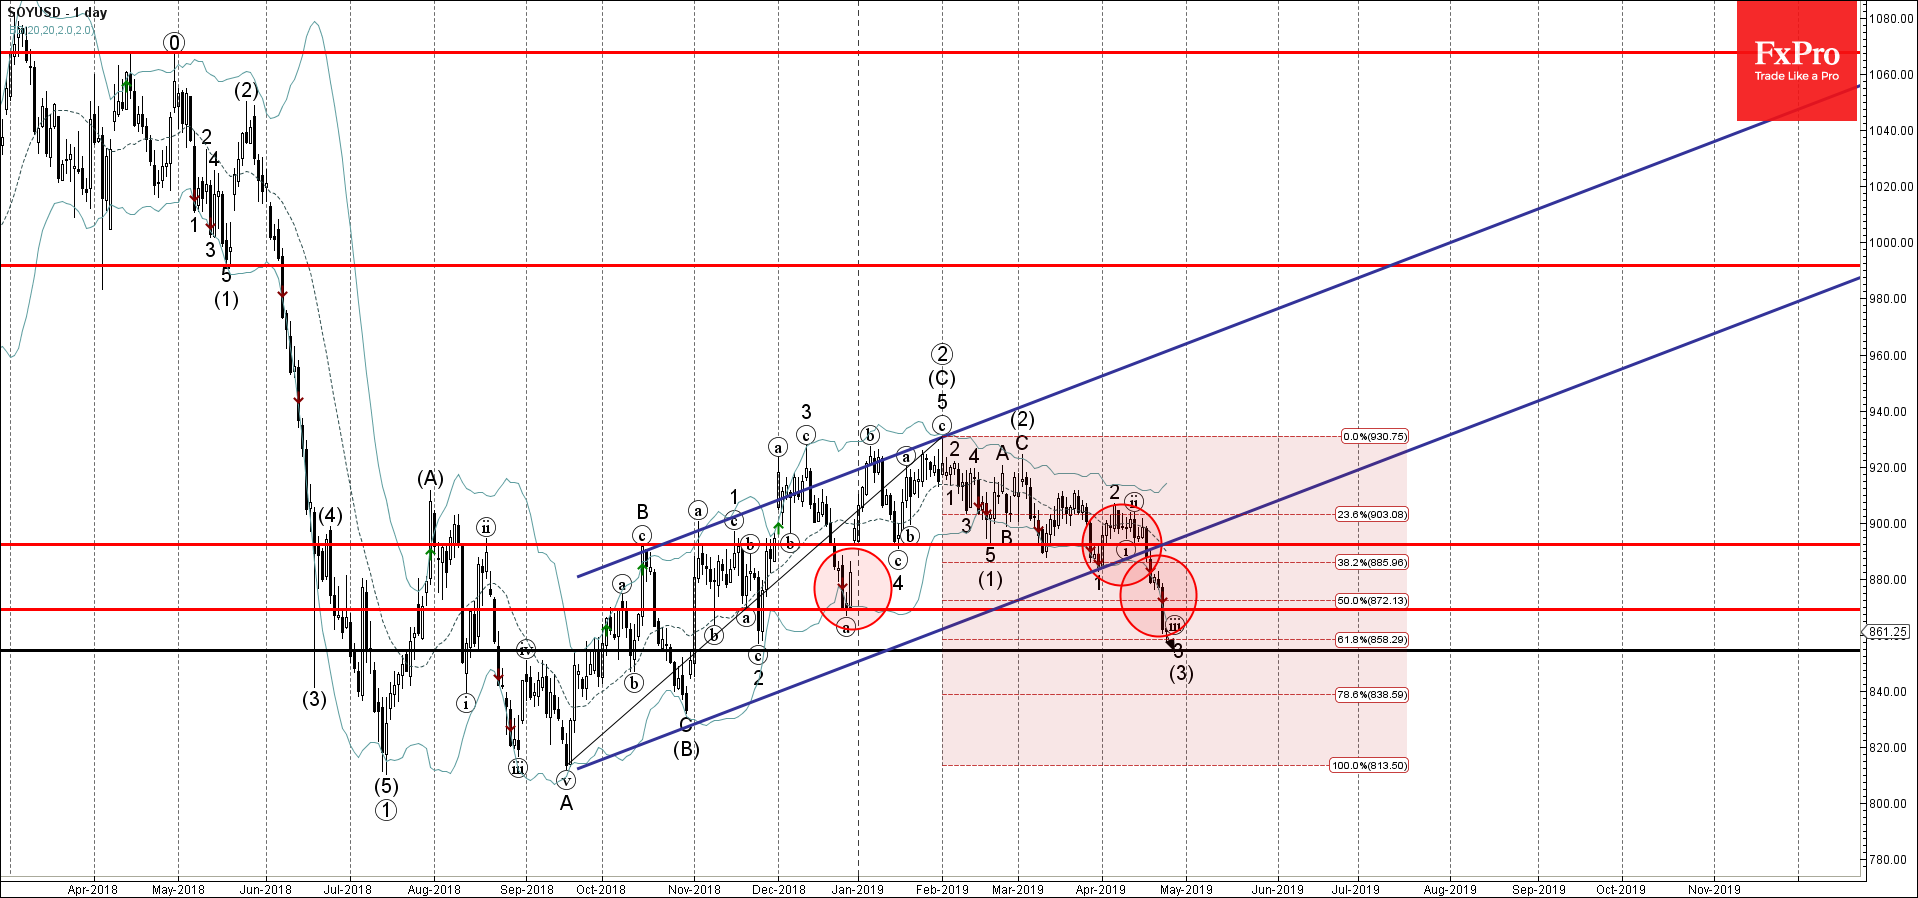
Soy continues to fall after the recent breakout of the support area lying between the support level 870.00 (monthly low from December) and the 50% Fibonacci correction of the previous upward impulse from September.
The breakout of this support area accelerated the active impulse wave 3 of the medium-term downward impulse wave (3) from the start of March.
Soy is expected to fall further and re-test the next support level 854.50 (monthly low from November).
The monthly ADP labour market report showed that America created 192K new jobs in April, above…
Bears showed strength ahead of the FOMC decision. U.S. indices sagged on Tuesday as investors…
Market Picture Bitcoin's closing price on Tuesday became the lowest since late February, confirming the…
- Ebay under the bearish pressure - Likely to fall to support level 51.00 Ebay…
- GBPAUD reversed from key support level 1.9135 - Likely to rise to resistance level…
Silver has lost 2.6% since the start of the day on Tuesday to $26.4 per…
This website uses cookies