Categories: Technical analysis

Palladium Wave Analysis – 02 November , 2018

  • Palladium reversed from support area
  • Further gains are likely

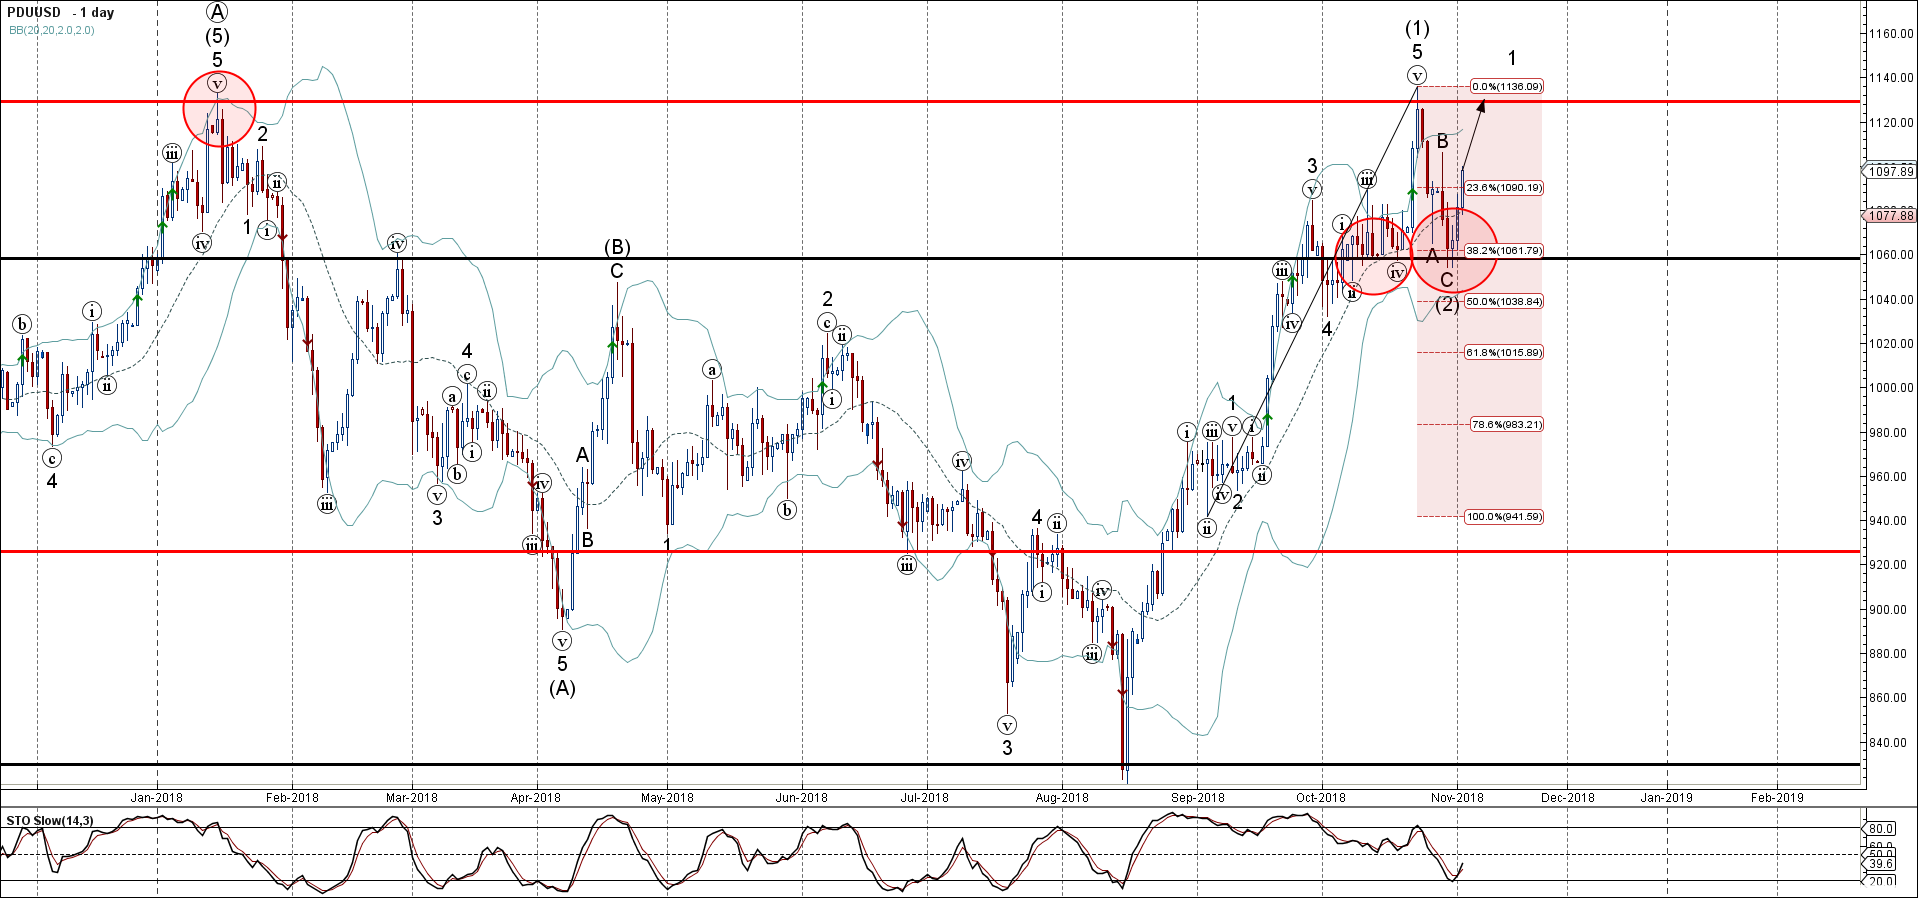
Palladium recently reversed up sharply from the support area lying between the key support level 1060.00 (which has been reversing the pair from the start of October) and the 38.2% Fibonacci correction of the previous sharp impulse wave from September.

The upward reversal form the aforementioned support area created the daily Japanese candlesticks reversal pattern Morning Star – which marked the start of eth active impulse wave (3).

Palladium is expected to rise further and re-test the next resistance level 1130.00 (which stopped the previous 2 sharp uptrends in January and October).

The FxPro Tech Analysis Team

The FxPro technical experts prepare a daily analysis of the most active currency pairs (majors, crosses, exotics) and commodities. Selected instruments are reviewed on daily trends (D1, H4), using the active Elliott Wave setups, Japanese candlesticks, indicators, and support/resistance levels.

Share
Published by
The FxPro Tech Analysis Team
Tags: PDUUSD2

Recent Posts

Adobe Wave Analysis 3 May 2024

- Adobe reversed from support zone - Likely to rise to resistance level 500.00 Adobe…

1 day ago

EURGBP Wave Analysis 3 May 2024

- EURJPY reversed from support zone - Likely to rise to resistance level 0.8625 EURGBP…

1 day ago

How Low Can the USDJPY Go?

USDJPY was slipping below 153 on Friday morning, a three-week low and having lost over…

2 days ago

Bitcoin’s Downtrend, Solana and Ethereum Form Double Bottom

Market picture  Crypto market capitalisation rose 3.3% in 24 hours to $2.22 trillion. Local capitalisation…

2 days ago

EURJPY Wave Analysis 2 May 2024

- EURJPY under strong bearish pressure - Likely to fall to support level 163.10 EURJPY…

3 days ago

WTI crude oil Wave Analysis 2 May 2024

- WTI broke round support level 80.00 - Likely to fall to support level 76.00…

3 days ago

This website uses cookies