• NZDUSD reversed from support area • Further gains are likely
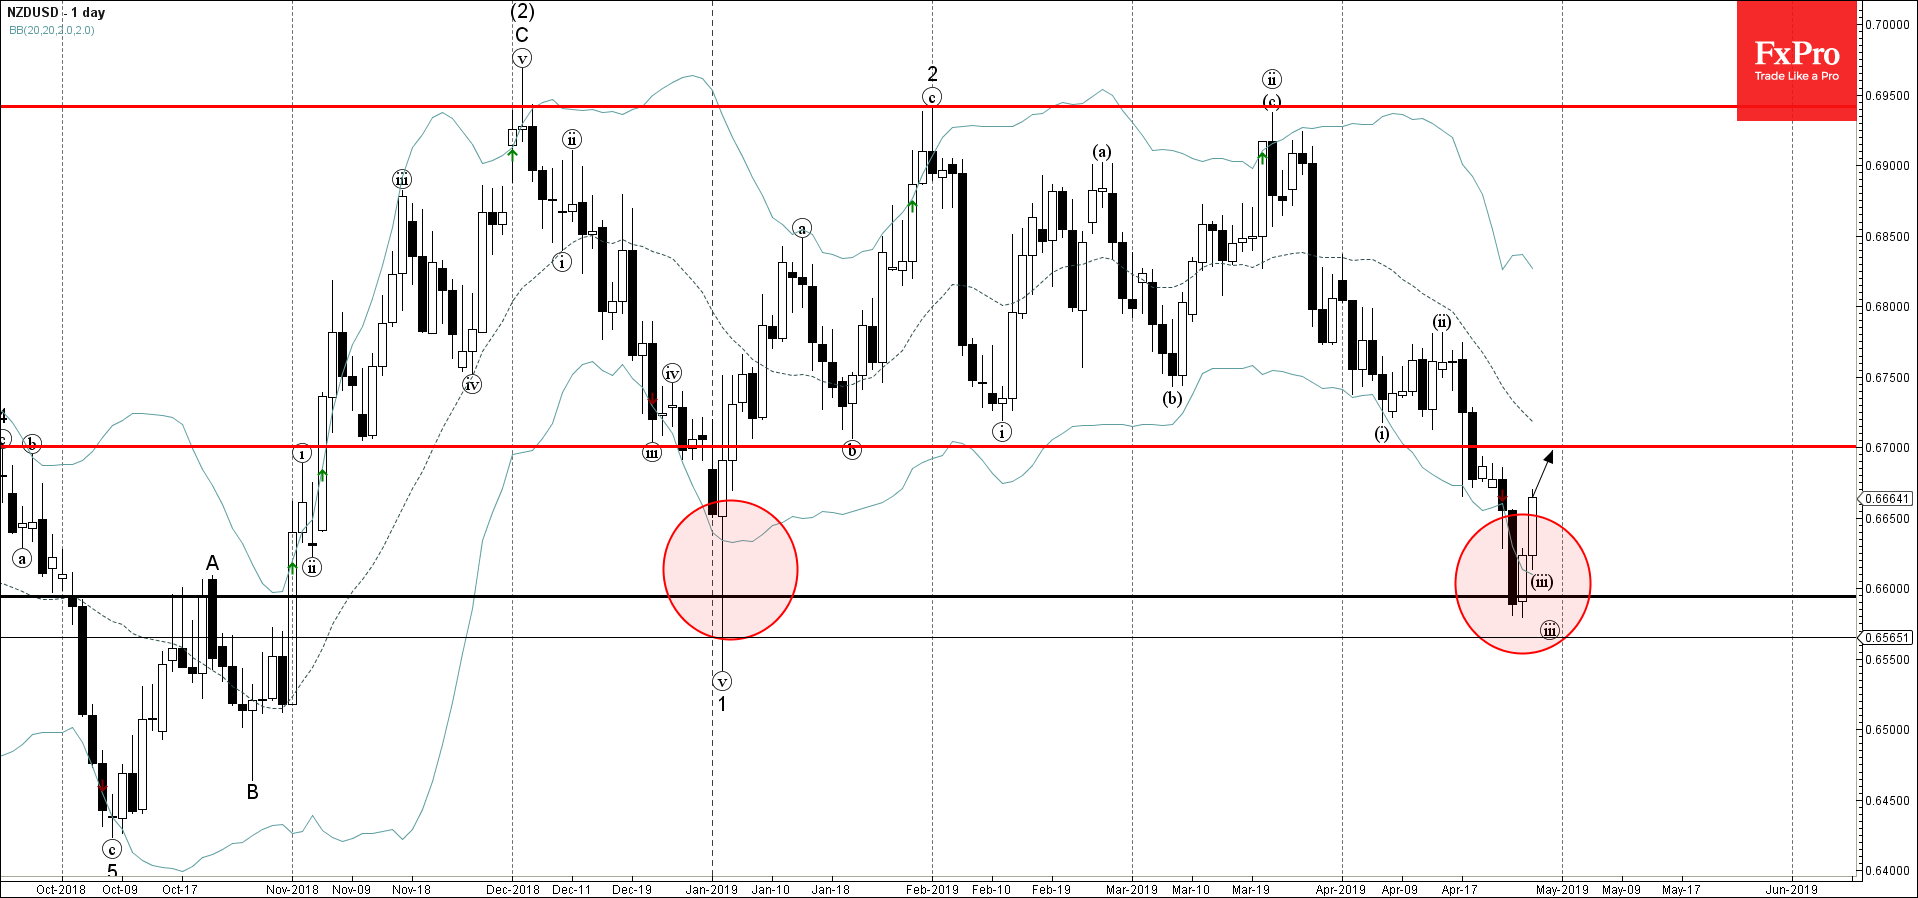
NZDUSD continues to rise after the recent upward reversal from the support area lying between the support level 0.6600 (which also reversed the price in January) and the lower daily Bollinger Band.
The upward reversal from this support area started the active short-term ABC correction (ii) – which belongs to the longer-term impulse waves 3 and (3).
NZDUSD is expected to rise further and re-test the next resistance level 0.6700 (former support from January).
Market picture Crypto market capitalisation has been up 2% over the past seven days and…
- Adobe reversed from support zone - Likely to rise to resistance level 500.00 Adobe…
- EURJPY reversed from support zone - Likely to rise to resistance level 0.8625 EURGBP…
USDJPY was slipping below 153 on Friday morning, a three-week low and having lost over…
Market picture Crypto market capitalisation rose 3.3% in 24 hours to $2.22 trillion. Local capitalisation…
- EURJPY under strong bearish pressure - Likely to fall to support level 163.10 EURJPY…
This website uses cookies