Categories: Technical analysis

NZDUSD Wave Analysis – 10 April, 2020

  • NZDUSD broke round resistance level 0.6000
  • Likely to rise to 0.6200

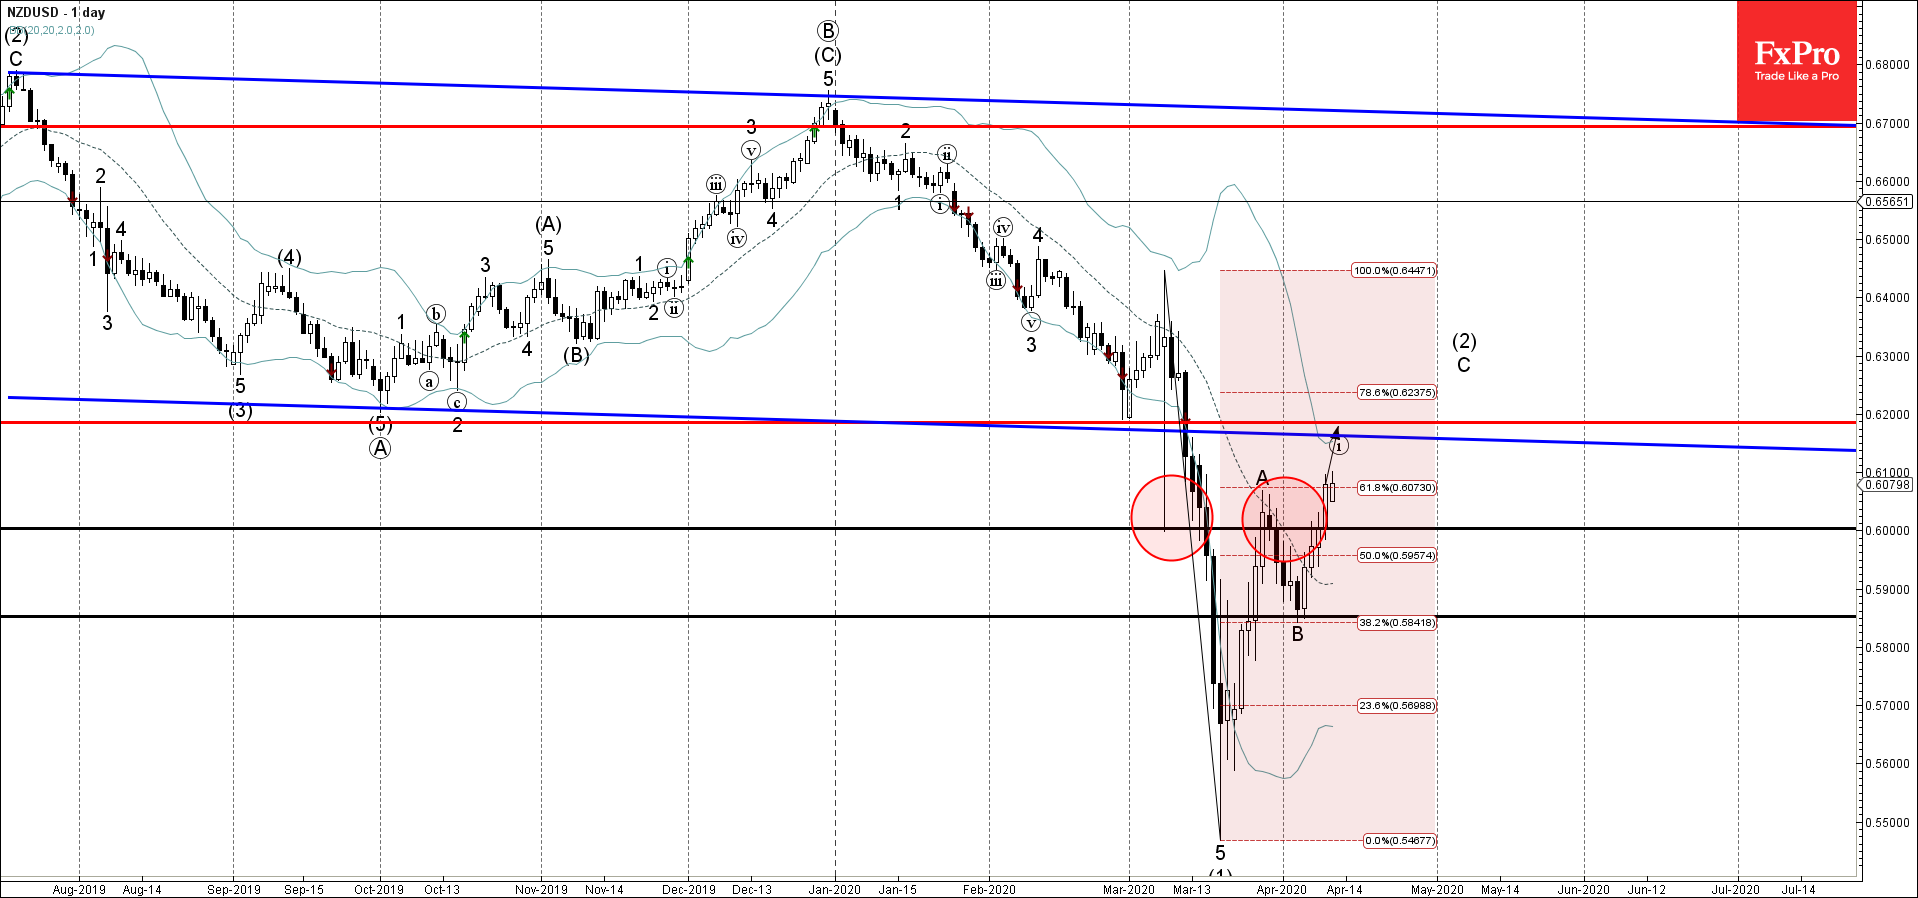
NZDUSD recently broke through the round resistance level 0.6000 (former low of the daily Japanese candlesticks reversal pattern Long-legged Doji from the start of March).

The breakout of the resistance level 0.6000 accelerated the C-wave of the active ABC correction (2) from last month.

NZDUSD is likely to rise further toward the next resistance level 0.6200 (former strong support from February intersecting with the lower trendline of the weekly down channel from 2018).

The FxPro Tech Analysis Team

The FxPro technical experts prepare a daily analysis of the most active currency pairs (majors, crosses, exotics) and commodities. Selected instruments are reviewed on daily trends (D1, H4), using the active Elliott Wave setups, Japanese candlesticks, indicators, and support/resistance levels.

Share
Published by
The FxPro Tech Analysis Team
Tags: NZDUSD

Recent Posts

Crypto Market Tries to Break Local Downtrend 

Market picture  Crypto market capitalisation has been up 2% over the past seven days and…

2 hours ago

Adobe Wave Analysis 3 May 2024

- Adobe reversed from support zone - Likely to rise to resistance level 500.00 Adobe…

3 days ago

EURGBP Wave Analysis 3 May 2024

- EURJPY reversed from support zone - Likely to rise to resistance level 0.8625 EURGBP…

3 days ago

How Low Can the USDJPY Go?

USDJPY was slipping below 153 on Friday morning, a three-week low and having lost over…

3 days ago

Bitcoin’s Downtrend, Solana and Ethereum Form Double Bottom

Market picture  Crypto market capitalisation rose 3.3% in 24 hours to $2.22 trillion. Local capitalisation…

3 days ago

EURJPY Wave Analysis 2 May 2024

- EURJPY under strong bearish pressure - Likely to fall to support level 163.10 EURJPY…

4 days ago

This website uses cookies