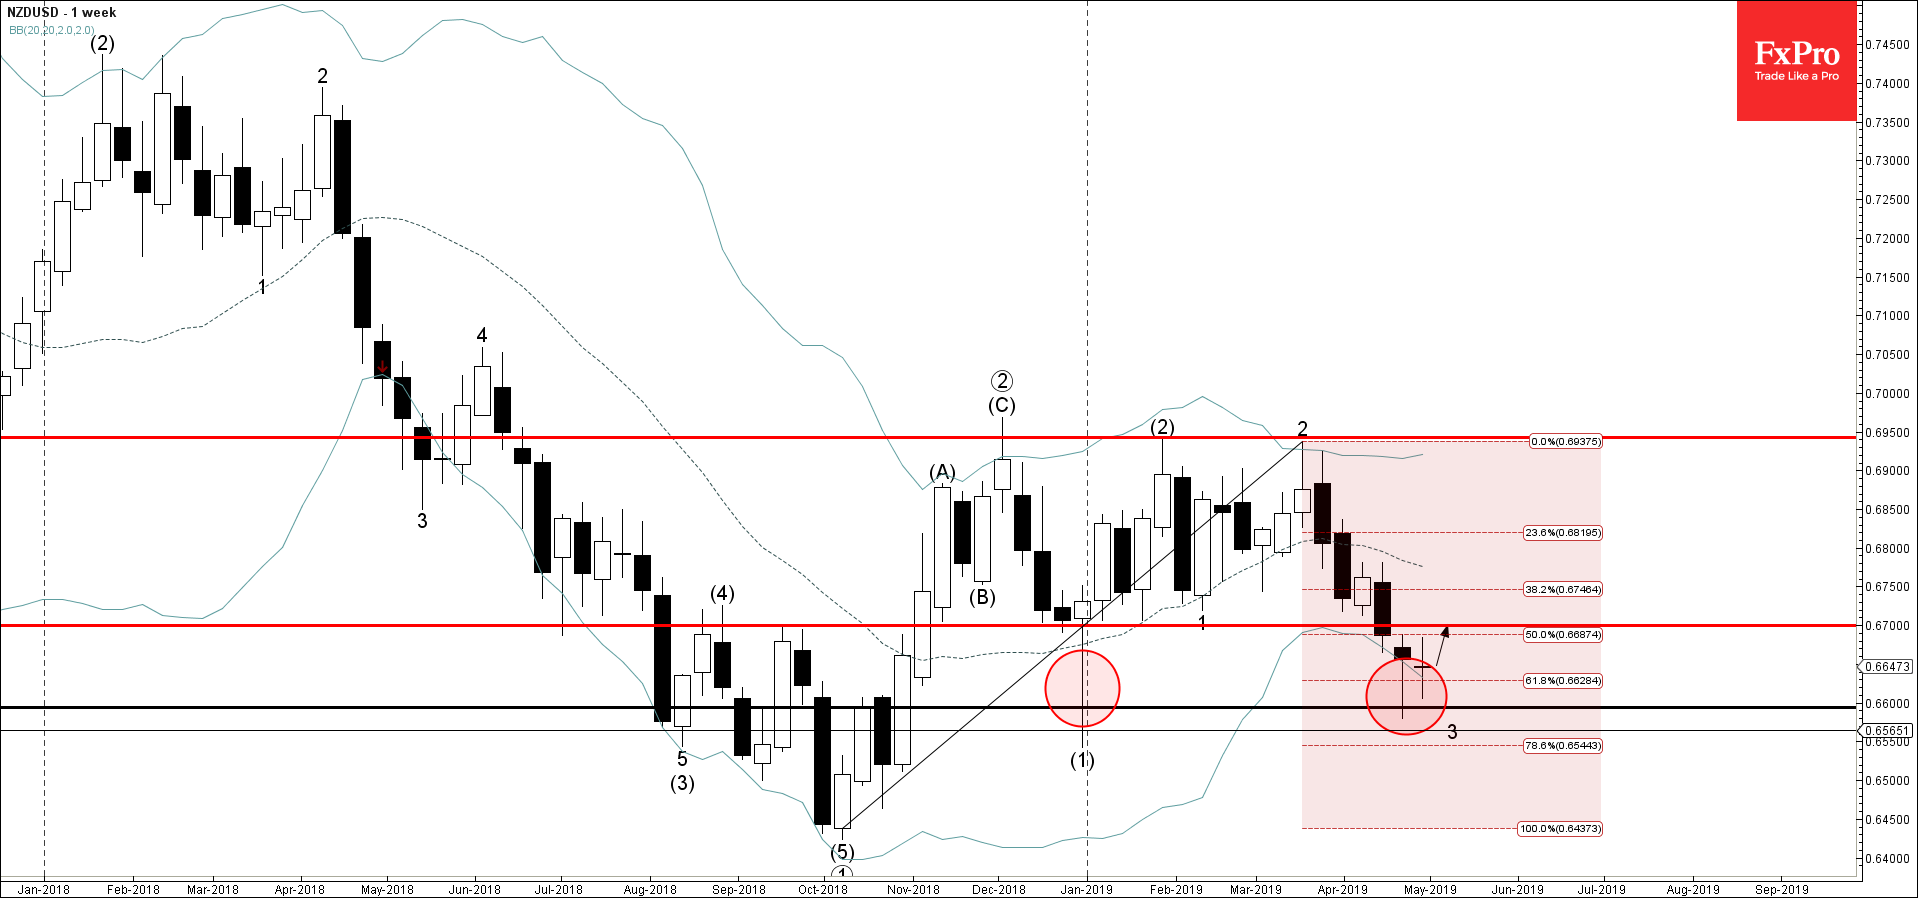
NZDUSD recently reversed up from the support area lying between the key support level 0.6600 (monthly low from the end of December) and the lower daily Bollinger Band.
The upward reversal from this support area created the weekly Japanese candlesticks reversal pattern Hammer – standing outside of the lower weekly Bollinger Band.
NZDUSD is expected to rise further and re-test the next resistance level 0.6700 (former support from January).
- WTI crude oil reversed from support area - Likely to rise to resistance level…
- AUDJPY reversed from support area - Likely to rise to resistance level 103.00 AUDJPY…
German industrial production continues to decline. The rate of contraction in March was slightly better…
US indices have been gaining daily since the beginning of May. They have found strength…
Market picture The crypto market has lost 2% of its capitalisation over the last 24…
- S&P 500 reversed from support level 5000.00 - Likely to rise to resistance level…
This website uses cookies