Categories: Technical analysis

NZDCHF Wave Analysis – 28 February, 2019

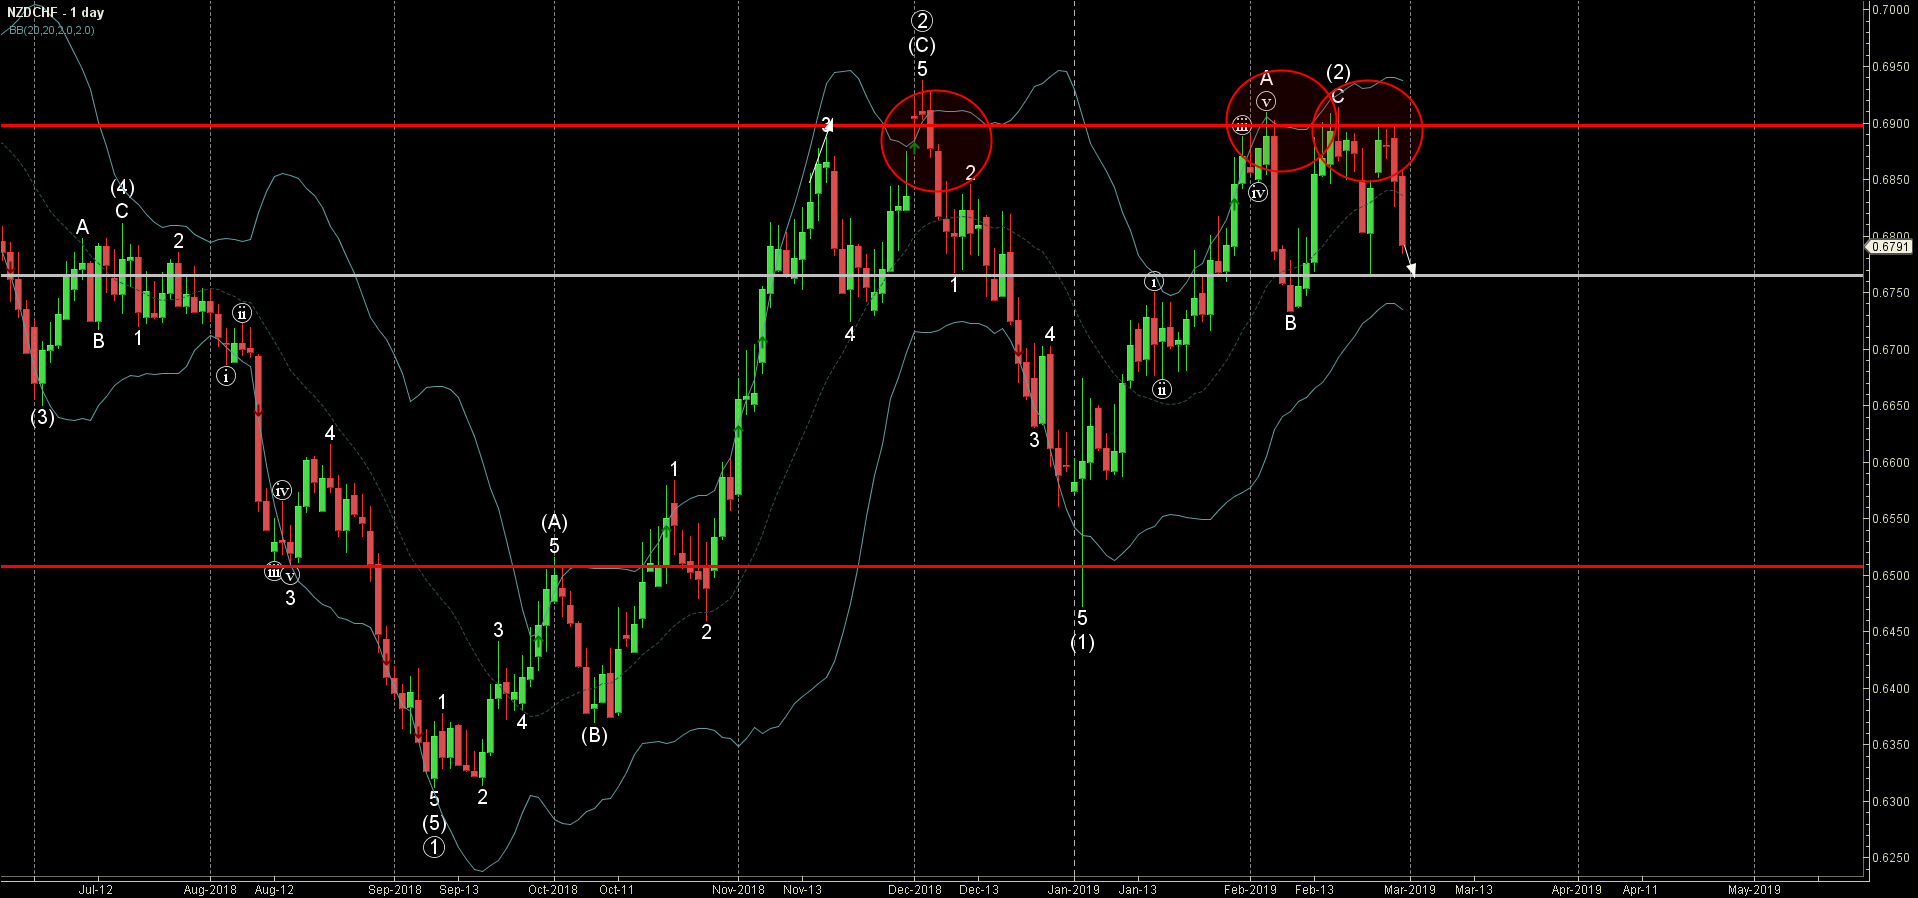
  • NZDCHF reversed from resistance area
  • Further losses are likely

NZDCHF recently reversed down from the resistance area lying between the key resistance level 0.6900 (which has been revering the price from December) and the upper daily Bollinger Band.

The downward reversal from this resistance area created the daily Japanese candlesticks reversal pattern Evening Star.

NZDCHF is expected to fall further and re-test the next support level 0.6760.

The FxPro Tech Analysis Team

The FxPro technical experts prepare a daily analysis of the most active currency pairs (majors, crosses, exotics) and commodities. Selected instruments are reviewed on daily trends (D1, H4), using the active Elliott Wave setups, Japanese candlesticks, indicators, and support/resistance levels.

Share
Published by
The FxPro Tech Analysis Team
Tags: NZDCHF

Recent Posts

Gold Wave Analysis – 15 May, 2024

• Gold broke daily down channel • Likely to reach resistance level 2415.00 Gold recently…

16 hours ago

AUDUSD Wave Analysis – 15 May, 2024

• AUDUSD broke key resistance level 0.6650 • Likely to reach resistance level 0.6760 AUDUSD…

16 hours ago

EURUSD is trying to break the 5-month downtrend

The US dollar has been under relentless pressure since last Thursday, approaching more than one-month…

18 hours ago

Matured altcoins are losing strength

Market Picture Neither the meme mania in equities, the overall positivity in stock indices, nor…

24 hours ago

EURCHF Wave Analysis – 14 May, 2024

• EURCHF rising inside impulse wave 3 • Likely to reach resistance level 0.9835 EURCHF…

2 days ago

Goldman Sachs Wave Analysis – 14 May, 2024

• Goldman Sachs broke the key resistance level 430.00 • Likely to rise to resistance…

2 days ago

This website uses cookies