Categories: Technical analysis

NZDCHF Wave Analysis – 22 October, 2019

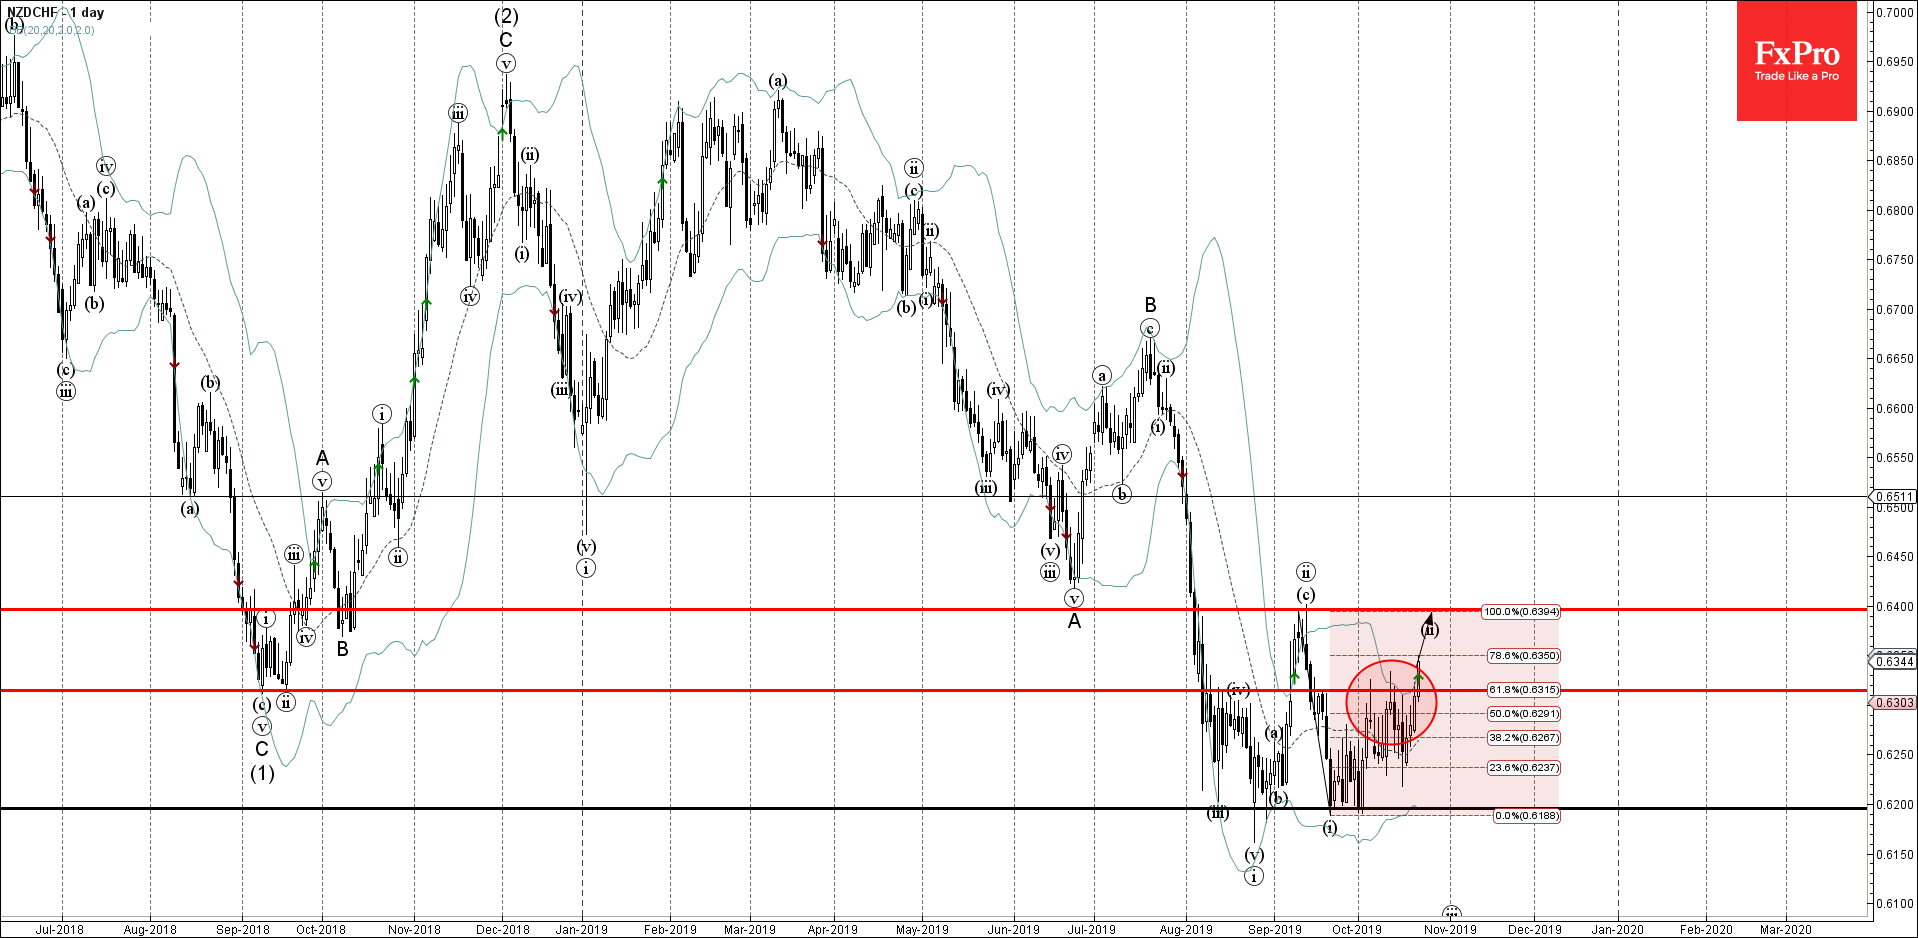
  • NZDCHF broke resistance zone
  • Likely to rise to 0.6400

NZDCHF continues to rise inside the short-term corrective wave (ii) – which recently broke through the resistance zone lying between the resistance level 0.6315 and the 61.8% Fibonacci correction of the previous downward impulse (i) from September.

The breakout of this resistance zone strengthened the bullish pressure on this currency pair.

NZDCHF is expected to rise further and retest the next resistance level 0.6400 (monthly high from September and the target price calculated for the completion of the active wave (ii)).

The FxPro Tech Analysis Team

The FxPro technical experts prepare a daily analysis of the most active currency pairs (majors, crosses, exotics) and commodities. Selected instruments are reviewed on daily trends (D1, H4), using the active Elliott Wave setups, Japanese candlesticks, indicators, and support/resistance levels.

Share
Published by
The FxPro Tech Analysis Team
Tags: NZDCHF

Recent Posts

USDJPY Wave Analysis 26 April 2024

- USDJPY broke key resistance level 155.00 - Likely to rise to resistance level 160.00…

1 day ago

Ebay Wave Analysis 26 April 2024

- Ebay reversed from support level 49.35 - Likely to rise to resistance level 52.55…

1 day ago

False Alert with Yen Interventions?

Even though the Bank of Japan left the key rate and parameters of the QE…

1 day ago

Cooler Bitcoin

Market picture  Market Dynamics: The cryptocurrency market stabilised, losing just 0.1% of capitalisation and dropping to…

2 days ago

GBPCAD Wave Analysis 25 April 2024

- GBPCAD reversed from key support level 1.6910 - Likely to rise to resistance level…

2 days ago

GBPAUD Wave Analysis 25 April 2024

- GBPAUD reversed from support level 1.9135 - Likely to rise to resistance level 1.9360…

2 days ago

This website uses cookies