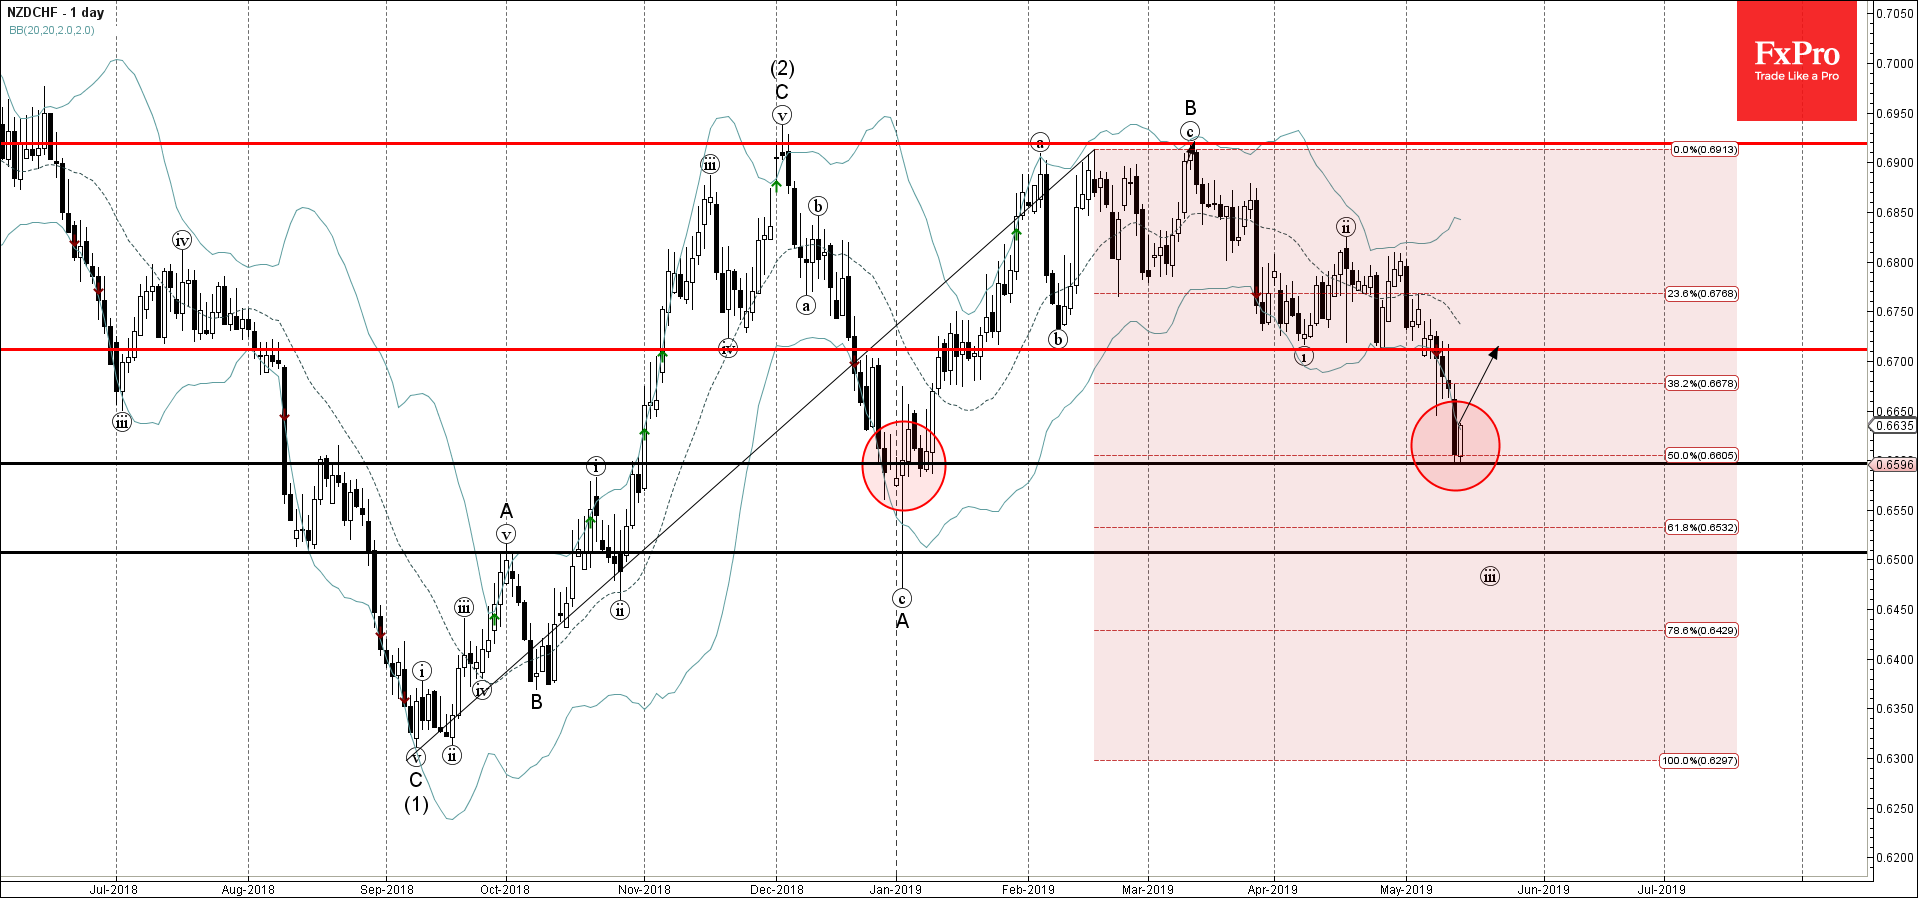
NZDCHF recently reversed up from the support area lying between the support level 0.6600 (which stopped the previous downward correction in January), lower daily Bollinger Band and the 50% Fibonacci correction of the upward impulse from September.
The upward reversal from this support area stopped the previous short-term impulse wave (iii) from the middle of April.
NZDCHF is expected to rise further and retest the next resistance level 0.6710 (former strong support from April).
- Ebay under the bearish pressure - Likely to fall to support level 51.00 Ebay…
- GBPAUD reversed from key support level 1.9135 - Likely to rise to resistance level…
Silver has lost 2.6% since the start of the day on Tuesday to $26.4 per…
Market picture The crypto market capitalisation decreased by another 1.5% to $2.27 trillion, getting closer…
ANF reversed from key support level 113.40 Likely to rise to resistance level 132.31 ANF…
- GBPUSD rising inside minor correction 2 - Likely to rise to resistance level 1.2700…
This website uses cookies