Categories: Technical analysis

NZDCAD Wave Analysis – 27 May, 2020

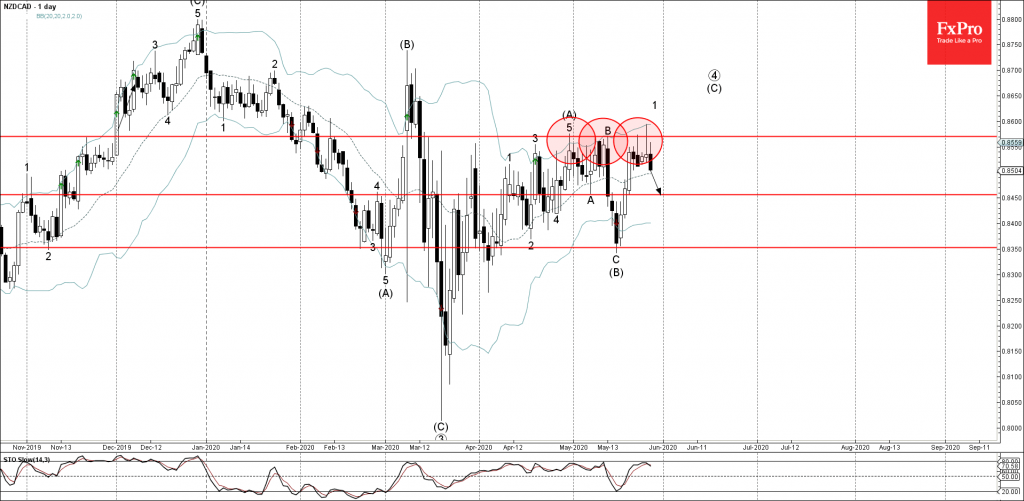
• NZDCAD reversed from key resistance level 0.8570

• Likely to fall to 0.8450

NZDCAD recently reversed down from the key resistance level 0.8570, standing close to the upper daily Bollinger Band.

The downward reversal from the resistance level 0.8570 created the daily Japanese candlestick reversal pattern Shooting Star.

NZDCAD is likely to fall further toward the next support level 0.8450 (former support from the start of May).

The FxPro Tech Analysis Team

The FxPro technical experts prepare a daily analysis of the most active currency pairs (majors, crosses, exotics) and commodities. Selected instruments are reviewed on daily trends (D1, H4), using the active Elliott Wave setups, Japanese candlesticks, indicators, and support/resistance levels.

Share
Published by
The FxPro Tech Analysis Team
Tags: NZDCAD

Recent Posts

Adobe Wave Analysis 9 May 2024

- Adobe reversed from resistance level 500.00 - Likely to fall to support level 460.00…

11 hours ago

Goldman Sachs Wave Analysis 9 May 2024

- Goldman Sachs rising inside impulse waves 3 and (3) - Likely to rise to…

11 hours ago

WTI crude oil Wave Analysis 8 May 2024

- WTI crude oil reversed from support area - Likely to rise to resistance level…

1 day ago

AUDJPY Wave Analysis 8 May 2024

- AUDJPY reversed from support area - Likely to rise to resistance level 103.00 AUDJPY…

1 day ago

German industrial production slide brings closer ECB’s rate cut

German industrial production continues to decline. The rate of contraction in March was slightly better…

2 days ago

US indices are heading towards highs

US indices have been gaining daily since the beginning of May. They have found strength…

2 days ago

This website uses cookies