Categories: Technical analysis

NZDCAD Wave Analysis 24 March, 2021

• NZDCAD falling inside sharp impulse wave 3

• Likely to reach support level 0.8635

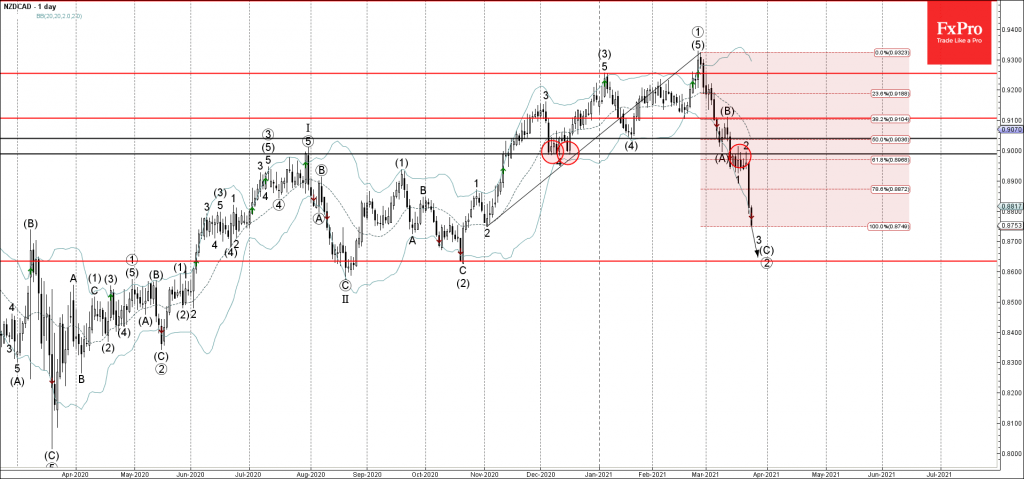
NZDCAD continues to fall inside the sharp impulse wave 3 which started earlier from the resistance zone lying between the resistance level 0.900 (former support from December) and the 61.8% Fibonacci correction of the upward impulse from November.

The active impulse wave 3 belongs to the intermediate impulse sequence (C) from the start of March.

NZDCAD is likely to fall further toward the next support level 0.8635 (multi-month low from October and the target price for the completion of the active impulse wave (C)).

The FxPro Tech Analysis Team

The FxPro technical experts prepare a daily analysis of the most active currency pairs (majors, crosses, exotics) and commodities. Selected instruments are reviewed on daily trends (D1, H4), using the active Elliott Wave setups, Japanese candlesticks, indicators, and support/resistance levels.

Share
Published by
The FxPro Tech Analysis Team
Tags: NZDCAD

Recent Posts

Adobe Wave Analysis 3 May 2024

- Adobe reversed from support zone - Likely to rise to resistance level 500.00 Adobe…

23 hours ago

EURGBP Wave Analysis 3 May 2024

- EURJPY reversed from support zone - Likely to rise to resistance level 0.8625 EURGBP…

23 hours ago

How Low Can the USDJPY Go?

USDJPY was slipping below 153 on Friday morning, a three-week low and having lost over…

1 day ago

Bitcoin’s Downtrend, Solana and Ethereum Form Double Bottom

Market picture  Crypto market capitalisation rose 3.3% in 24 hours to $2.22 trillion. Local capitalisation…

1 day ago

EURJPY Wave Analysis 2 May 2024

- EURJPY under strong bearish pressure - Likely to fall to support level 163.10 EURJPY…

2 days ago

WTI crude oil Wave Analysis 2 May 2024

- WTI broke round support level 80.00 - Likely to fall to support level 76.00…

2 days ago

This website uses cookies