Categories: Technical analysis

NZDCAD Wave Analysis – 22 May, 2020

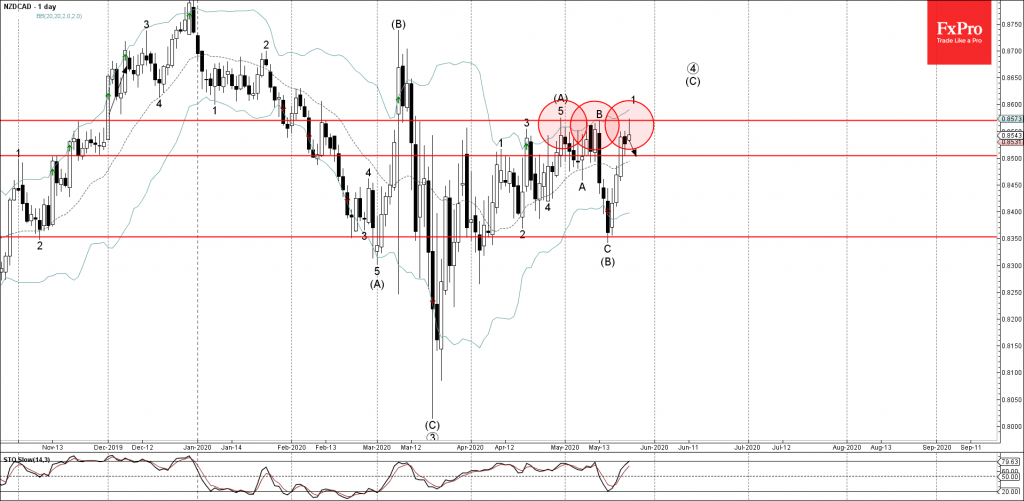
• NZDCAD reversed from resistance area

• Likely to fall to 0.8500

NZDCAD today corrected down from the resistance area lying between the key resistance level 0.8570 (which stopped the previous waves (A) and B, as can be seen below) and the upper daily Bollinger Band.

The downward reversal from this resistance area is likely to form the daily candlesticks reversal pattern Shooting Star – if the pair closes today near the current levels or lower.

NZDCAD is likely to fall further toward the next support level 0.8500 (yesterday’s low).

The FxPro Tech Analysis Team

The FxPro technical experts prepare a daily analysis of the most active currency pairs (majors, crosses, exotics) and commodities. Selected instruments are reviewed on daily trends (D1, H4), using the active Elliott Wave setups, Japanese candlesticks, indicators, and support/resistance levels.

Share
Published by
The FxPro Tech Analysis Team
Tags: NZDCAD

Recent Posts

USDJPY Wave Analysis 26 April 2024

- USDJPY broke key resistance level 155.00 - Likely to rise to resistance level 160.00…

17 hours ago

Ebay Wave Analysis 26 April 2024

- Ebay reversed from support level 49.35 - Likely to rise to resistance level 52.55…

17 hours ago

False Alert with Yen Interventions?

Even though the Bank of Japan left the key rate and parameters of the QE…

1 day ago

Cooler Bitcoin

Market picture  Market Dynamics: The cryptocurrency market stabilised, losing just 0.1% of capitalisation and dropping to…

1 day ago

GBPCAD Wave Analysis 25 April 2024

- GBPCAD reversed from key support level 1.6910 - Likely to rise to resistance level…

2 days ago

GBPAUD Wave Analysis 25 April 2024

- GBPAUD reversed from support level 1.9135 - Likely to rise to resistance level 1.9360…

2 days ago

This website uses cookies