Categories: Technical analysis

Natural gas Wave Analysis – 8 November, 2022

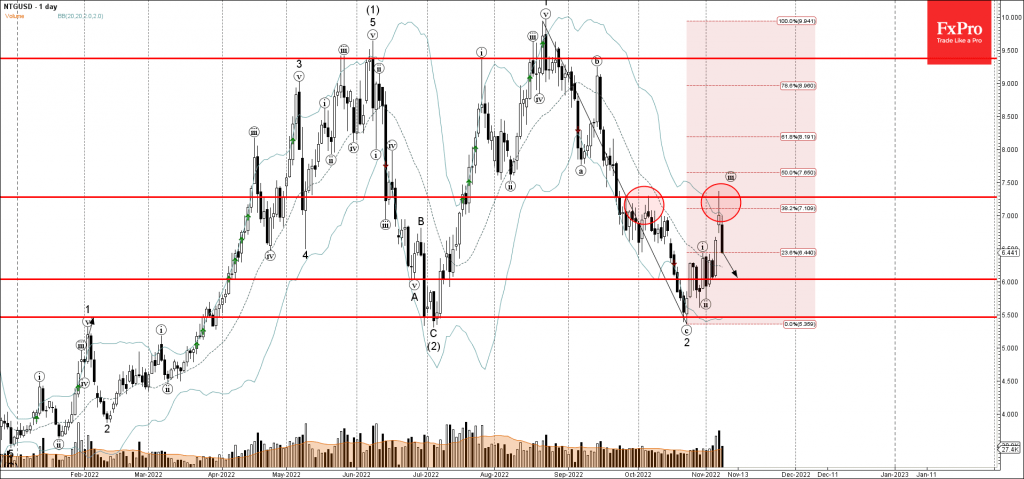
• Natural gas reversed from resistance area

• Likely to fall to support level 6.0000

Natural gas recently reversed down from the resistance area set between the resistance level 7.285 (former monthly high from October), upper daily Bollinger Band and the 38.2% Fibonacci correction of the downward impulse from August.

The downward reversal from the resistance level 7.285 created the daily Shooting Star, which stopped the earlier minor impulse wave (iii).

Natural gas can be expected to fall further toward the next round support level 6.0000 (which reversed the price at the start of this month).

The FxPro Tech Analysis Team

The FxPro technical experts prepare a daily analysis of the most active currency pairs (majors, crosses, exotics) and commodities. Selected instruments are reviewed on daily trends (D1, H4), using the active Elliott Wave setups, Japanese candlesticks, indicators, and support/resistance levels.

Share
Published by
The FxPro Tech Analysis Team

Recent Posts

EURUSD at the equilibrium, where will it go next? 

The single currency is trading near $1.076, waiting for further cues and facing serious resistance…

50 mins ago

Bitcoin can’t accelerate but won’t give up trying

Market picture  The crypto market capitalisation fell by 1.7% in 24 hours to $2.29 trillion,…

6 hours ago

USDJPY Wave Analysis 6 May 2024

- USDJPY reversed from support zone - Likely to rise to resistance level 155.65 USDJPY…

21 hours ago

Gold Wave Analysis 6 May 2024

- Gold reversed from support zone - Likely to rise to resistance level 2400.00 Gold…

21 hours ago

Oil Bounces Locally, Global Support 5% below Spot Price

The number of operating oil rigs in the US fell by 7 to 499. This…

1 day ago

Crypto Market Tries to Break Local Downtrend

Market picture  Crypto market capitalisation has been up 2% over the past seven days and…

1 day ago

This website uses cookies