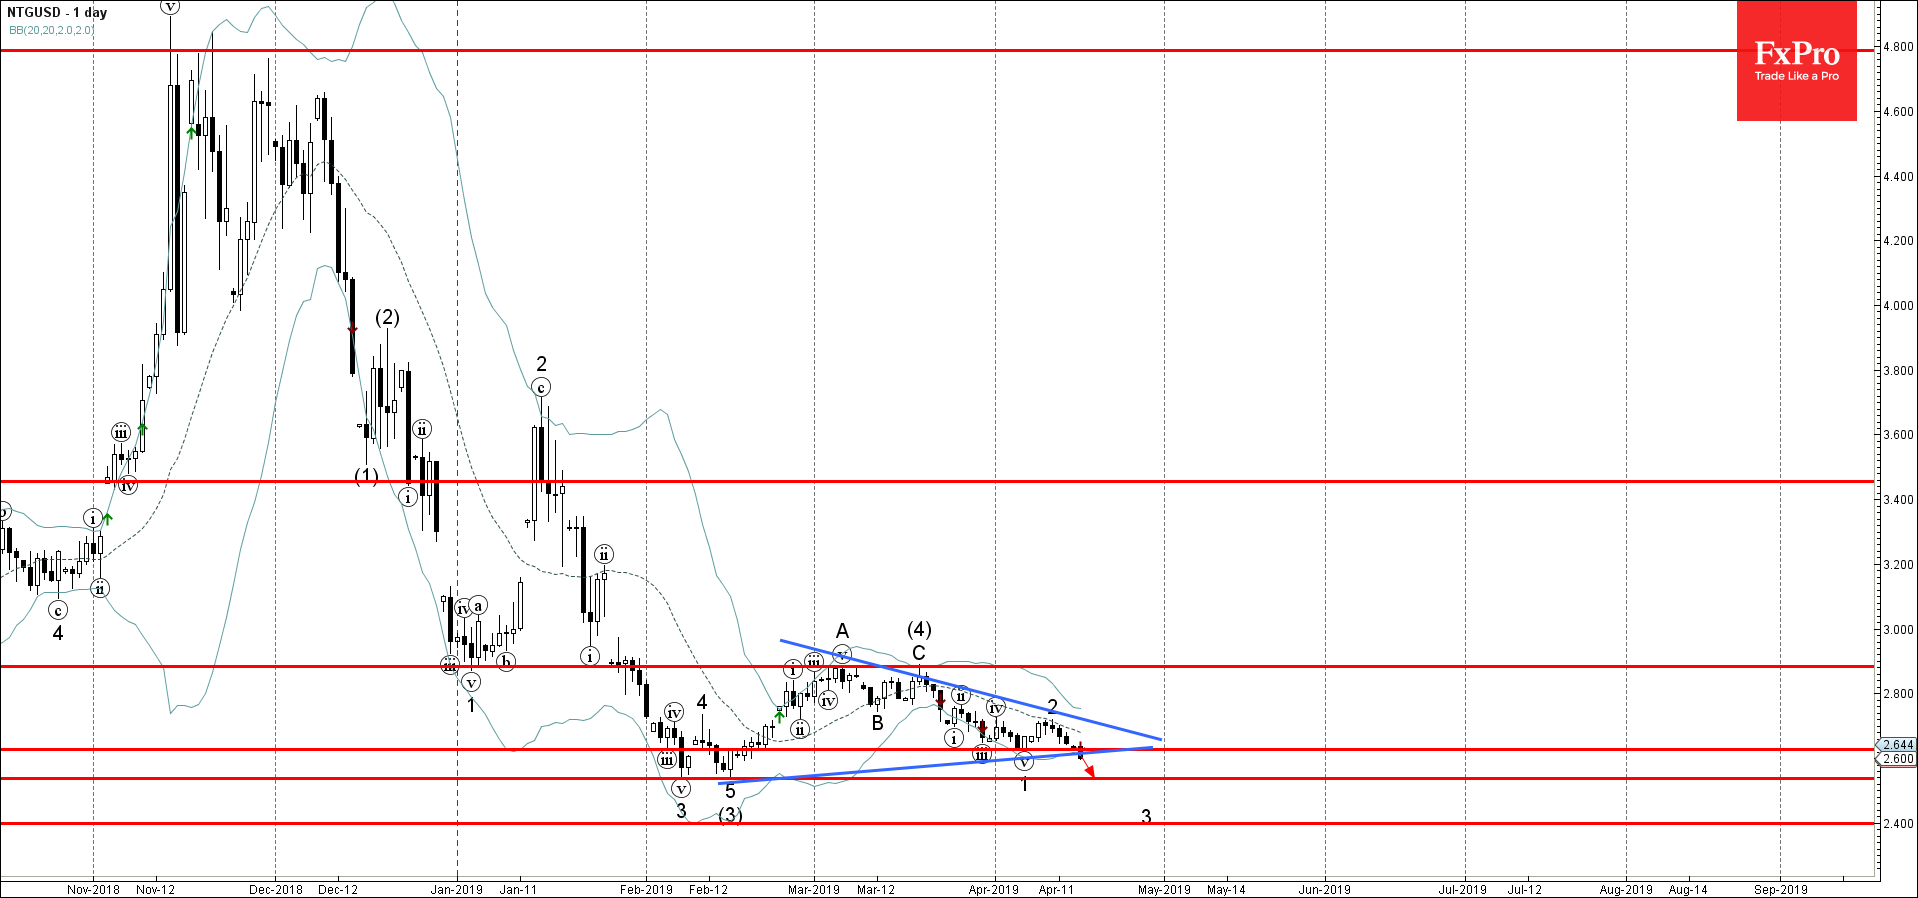
Natural Gas recently broke below the key support level 2.625 (which previously stopped the impulse 1 of the active downward medium-term impulse sequence (5) form March).
The breakout of the support level 2.625 coincided with breakout of the support trendline of the daily Triangle from February – which should accelerate the active impulse wave 3.
Natural Gas is expected to fall further and re-test the next support level 2.540 (low of the previous waves 3 and (3) from February).
USDJPY was slipping below 153 on Friday morning, a three-week low and having lost over…
Market picture Crypto market capitalisation rose 3.3% in 24 hours to $2.22 trillion. Local capitalisation…
- EURJPY under strong bearish pressure - Likely to fall to support level 163.10 EURJPY…
- WTI broke round support level 80.00 - Likely to fall to support level 76.00…
The monthly ADP labour market report showed that America created 192K new jobs in April, above…
Bears showed strength ahead of the FOMC decision. U.S. indices sagged on Tuesday as investors…
This website uses cookies