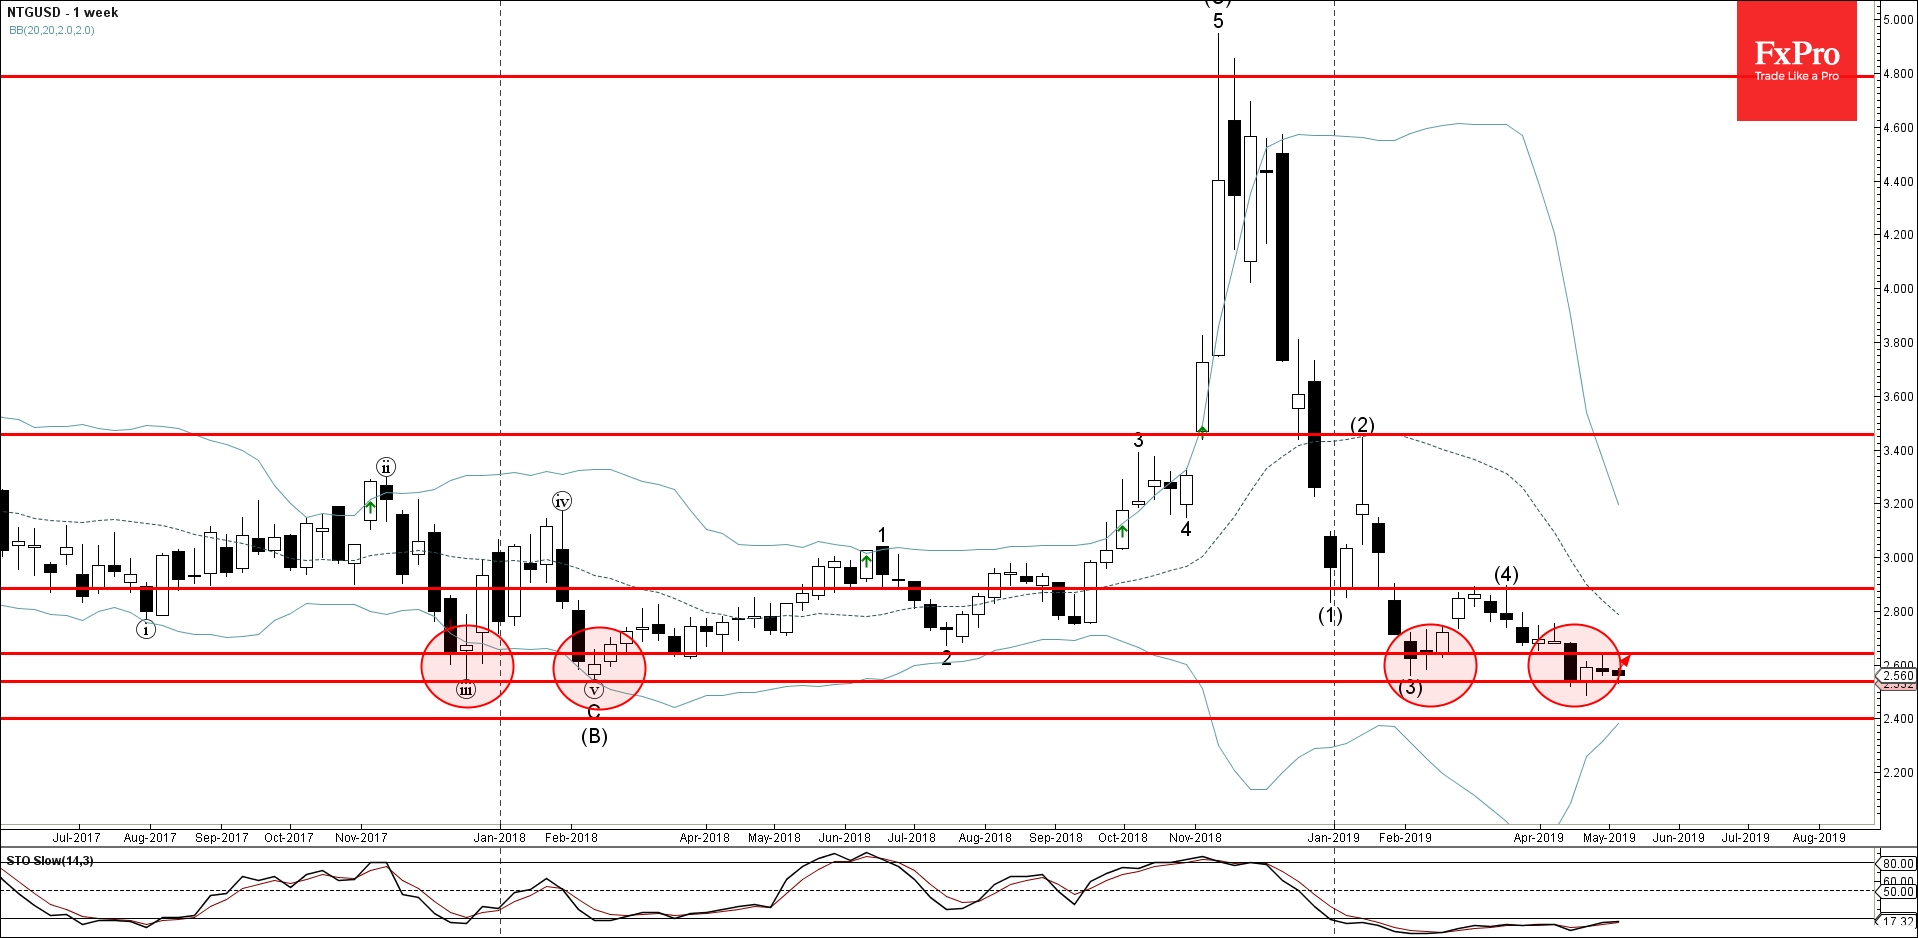
Natural Gas recently reversed up from the support area lying between the multi-month support level 2.540 and the lower weekly Bollinger Band.
The upward reversal from this support area stopped the previous medium-term impulse wave (5) from March.
Given the oversold reading on the weekly Stochastic indicator – Natural Gas is expected to rise further and re-test the next resistance level 2.643.
- Adobe reversed from support zone - Likely to rise to resistance level 500.00 Adobe…
- EURJPY reversed from support zone - Likely to rise to resistance level 0.8625 EURGBP…
USDJPY was slipping below 153 on Friday morning, a three-week low and having lost over…
Market picture Crypto market capitalisation rose 3.3% in 24 hours to $2.22 trillion. Local capitalisation…
- EURJPY under strong bearish pressure - Likely to fall to support level 163.10 EURJPY…
- WTI broke round support level 80.00 - Likely to fall to support level 76.00…
This website uses cookies