Categories: Technical analysis

Morgan Stanley Wave Analysis – 17 July, 2020

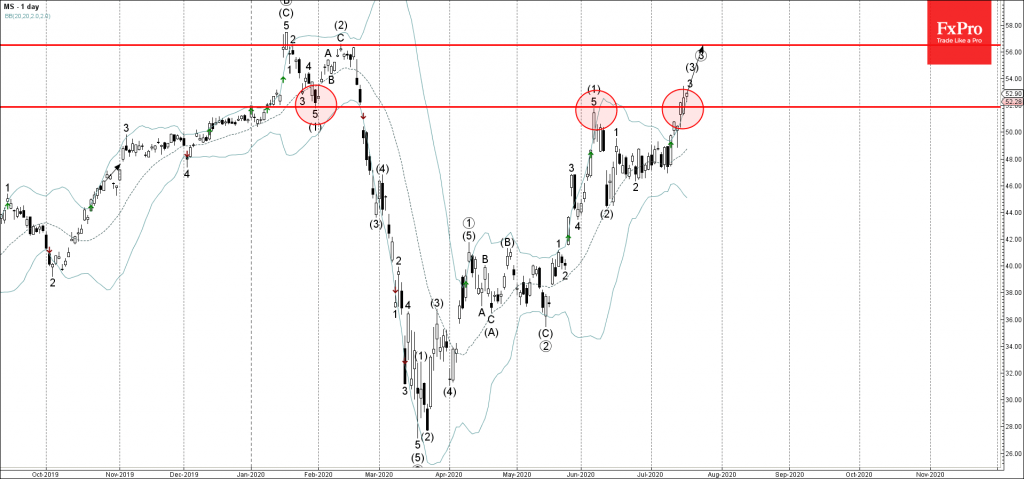
• Morgan Stanley broke key resistance level 51.90

• Likely to rise to 56.50

Morgan Stanley recently broke above the key resistance level 51.90 (former monthly high from June and the reversal pivot from the end of January).

The breakout of the resistance level 51.90 continues the active three upward impulse waves: 3, 3 and the longer-term impulse ③ from the middle of May.

Morgan Stanley is likely to rise further toward the next strong resistance level 56.50 (monthly high from February and the likely price for the completion of the active impulse wave ③).

The FxPro Tech Analysis Team

The FxPro technical experts prepare a daily analysis of the most active currency pairs (majors, crosses, exotics) and commodities. Selected instruments are reviewed on daily trends (D1, H4), using the active Elliott Wave setups, Japanese candlesticks, indicators, and support/resistance levels.

Share
Published by
The FxPro Tech Analysis Team
Tags: MS

Recent Posts

ADP hints at another strong NFP on Friday  

The monthly ADP labour market report showed that America created 192K new jobs in April, above…

1 day ago

Fed’s hawkish tone risks sinking S&P500 to 4700

Bears showed strength ahead of the FOMC decision.  U.S. indices sagged on Tuesday as investors…

1 day ago

A new stage of Bitcoin’s decline

Market Picture  Bitcoin's closing price on Tuesday became the lowest since late February, confirming the…

1 day ago

Ebay Wave Analysis 30 April 2024

- Ebay under the bearish pressure - Likely to fall to support level 51.00 Ebay…

2 days ago

GBPAUD Wave Analysis 30 April 2024

- GBPAUD reversed from key support level 1.9135 - Likely to rise to resistance level…

2 days ago

Silver: a possible long road down

Silver has lost 2.6% since the start of the day on Tuesday to $26.4 per…

2 days ago

This website uses cookies