Categories: Technical analysis

IBM Wave Analysis – 15 December, 2022

• IBM reversed from major long-term resistance level

• Likely to fall to support level 143.00

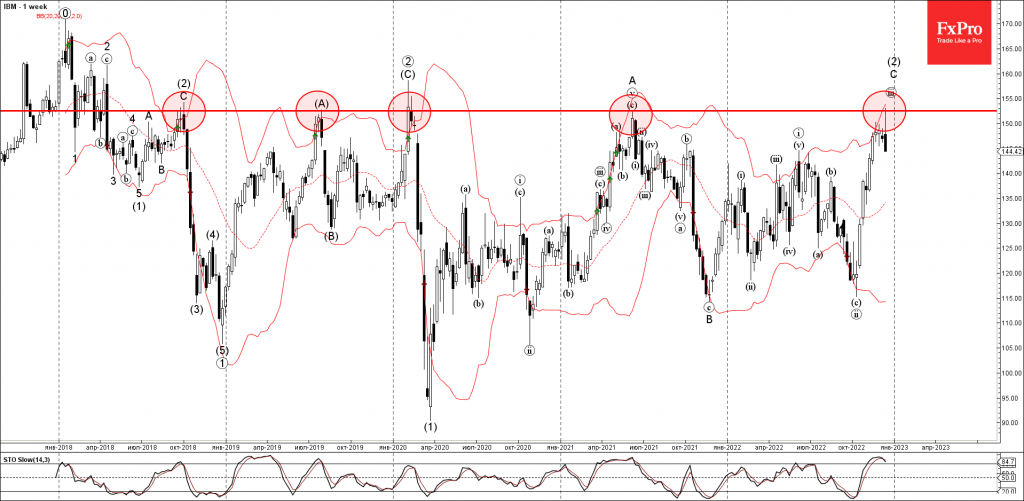
IBM under the bearish pressure after the price reversed down from the major long-term resistance level 152.50 (which has been reversing the price from the end of 2018) coinciding with the upper weekly Bollinger Band.

The downward reversal from the resistance level 152.50 stopped the previous weekly upward impulse wave C.

IBM can be expected to fall further toward the next support level 143.00 (former resistance from July).

The FxPro Tech Analysis Team

The FxPro technical experts prepare a daily analysis of the most active currency pairs (majors, crosses, exotics) and commodities. Selected instruments are reviewed on daily trends (D1, H4), using the active Elliott Wave setups, Japanese candlesticks, indicators, and support/resistance levels.

Share
Published by
The FxPro Tech Analysis Team
Tags: IBM

Recent Posts

WTI crude oil Wave Analysis 8 May 2024

- WTI crude oil reversed from support area - Likely to rise to resistance level…

6 hours ago

AUDJPY Wave Analysis 8 May 2024

- AUDJPY reversed from support area - Likely to rise to resistance level 103.00 AUDJPY…

6 hours ago

German industrial production slide brings closer ECB’s rate cut

German industrial production continues to decline. The rate of contraction in March was slightly better…

12 hours ago

US indices are heading towards highs

US indices have been gaining daily since the beginning of May. They have found strength…

14 hours ago

Persisting pressure on crypto

Market picture  The crypto market has lost 2% of its capitalisation over the last 24…

17 hours ago

S&P 500 Wave Analysis 7 May 2024

- S&P 500 reversed from support level 5000.00 - Likely to rise to resistance level…

1 day ago

This website uses cookies