Categories: Technical analysis

Goldman Sachs Wave Analysis – 27 February, 2020

  • Goldman Sachs broke support area
  • Likely to fall to 210.00

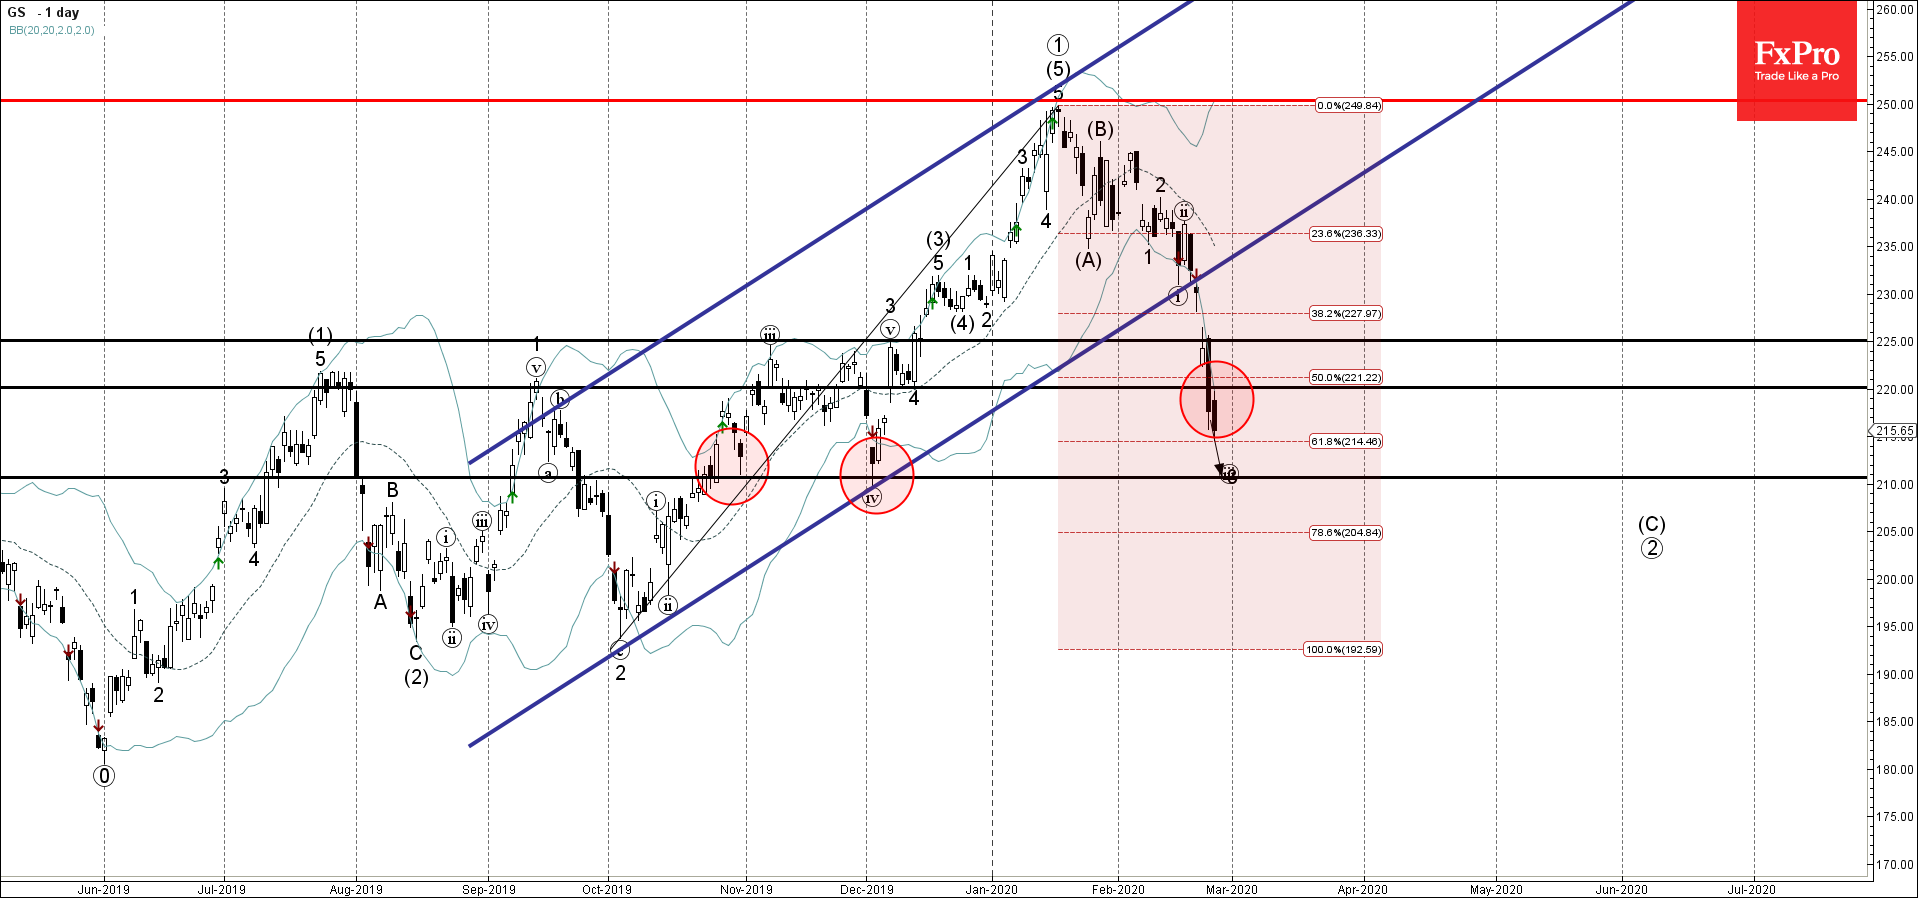
Goldman Sachs recently broke the support area lying between the key support level 220.00 (former correction low from December) and the 50% Fibonacci retracement of the earlier sharp upward impulse from October.

The breakout of this support area accelerated the active impulse waves 3 and (iii) – which belong to wave (C) from January.

Goldman Sachs is likely to fall down further toward the next support level 210.00 (former monthly low from December and the target for the termination of the active wave (iii)).

The FxPro Tech Analysis Team

The FxPro technical experts prepare a daily analysis of the most active currency pairs (majors, crosses, exotics) and commodities. Selected instruments are reviewed on daily trends (D1, H4), using the active Elliott Wave setups, Japanese candlesticks, indicators, and support/resistance levels.

Share
Published by
The FxPro Tech Analysis Team
Tags: GS

Recent Posts

USDJPY Wave Analysis 26 April 2024

- USDJPY broke key resistance level 155.00 - Likely to rise to resistance level 160.00…

13 hours ago

Ebay Wave Analysis 26 April 2024

- Ebay reversed from support level 49.35 - Likely to rise to resistance level 52.55…

13 hours ago

False Alert with Yen Interventions?

Even though the Bank of Japan left the key rate and parameters of the QE…

21 hours ago

Cooler Bitcoin

Market picture  Market Dynamics: The cryptocurrency market stabilised, losing just 0.1% of capitalisation and dropping to…

1 day ago

GBPCAD Wave Analysis 25 April 2024

- GBPCAD reversed from key support level 1.6910 - Likely to rise to resistance level…

2 days ago

GBPAUD Wave Analysis 25 April 2024

- GBPAUD reversed from support level 1.9135 - Likely to rise to resistance level 1.9360…

2 days ago

This website uses cookies