Categories: Technical analysis

Gold Wave Analysis – 19 April 2023

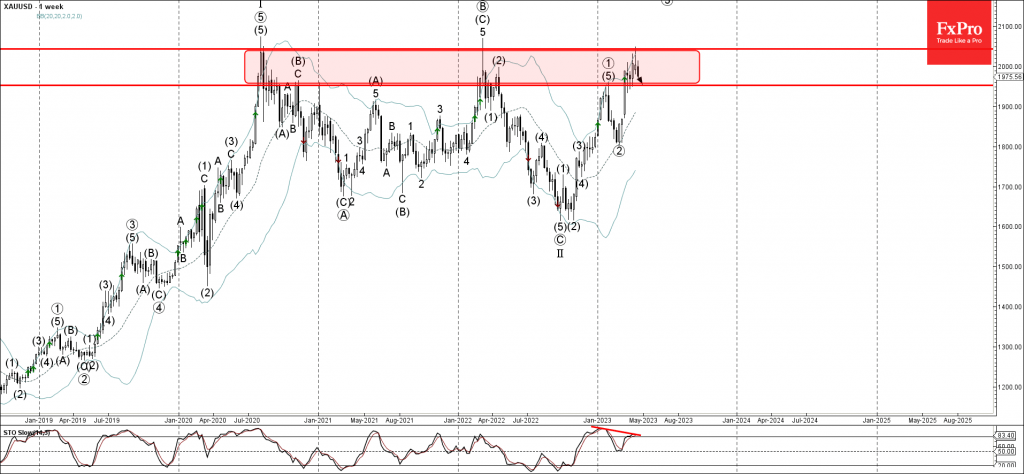
• Gold reversed from major resistance level 2050.00

• Likely to fall to support level 1953.00

Gold continues to fall after the price reversed down from the major resistance level 2050.00 (which is the upper boundary of the powerful resistance zone, which has been reversing the price from the middle of 2020) coinciding with the upper weekly Bollinger Band.

The downward reversal from the resistance level 2050.00 created the weekly Japanese candlesticks reversal pattern Shooting Star.

Given the bearish divergence on the weekly Stochastic, Gold can be expected to fall further toward the next support level 1953.00 (lower boundary of this resistance zone).

The FxPro Tech Analysis Team

The FxPro technical experts prepare a daily analysis of the most active currency pairs (majors, crosses, exotics) and commodities. Selected instruments are reviewed on daily trends (D1, H4), using the active Elliott Wave setups, Japanese candlesticks, indicators, and support/resistance levels.

Share
Published by
The FxPro Tech Analysis Team
Tags: gold

Recent Posts

Adobe Wave Analysis 3 May 2024

- Adobe reversed from support zone - Likely to rise to resistance level 500.00 Adobe…

15 hours ago

EURGBP Wave Analysis 3 May 2024

- EURJPY reversed from support zone - Likely to rise to resistance level 0.8625 EURGBP…

15 hours ago

How Low Can the USDJPY Go?

USDJPY was slipping below 153 on Friday morning, a three-week low and having lost over…

21 hours ago

Bitcoin’s Downtrend, Solana and Ethereum Form Double Bottom

Market picture  Crypto market capitalisation rose 3.3% in 24 hours to $2.22 trillion. Local capitalisation…

1 day ago

EURJPY Wave Analysis 2 May 2024

- EURJPY under strong bearish pressure - Likely to fall to support level 163.10 EURJPY…

2 days ago

WTI crude oil Wave Analysis 2 May 2024

- WTI broke round support level 80.00 - Likely to fall to support level 76.00…

2 days ago

This website uses cookies