Technical analysis
Gold Wave Analysis – 16 May 2023
May 16, 2023 @ 19:37 +03:00
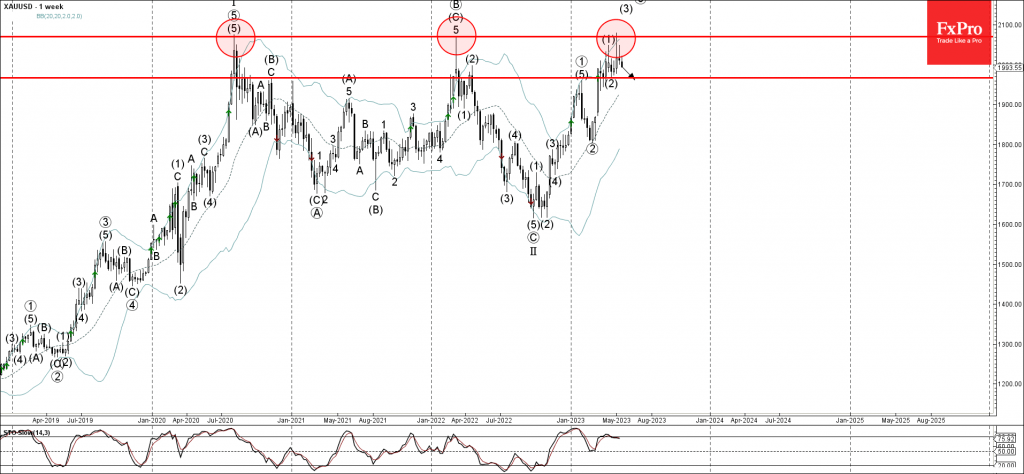
• Gold reversed from long-term resistance level 2070.00
• Likely to fall to support level 1966.00
Gold recently reversed down from the strong, long-term resistance level 2070.00 (previous yearly high from 2020 and 2022).
The resistance level 2070.00 was further strengthened by the upper weekly Bollinger Band.
Given the strength of the resistance level 2070.00 and the bearish divergence on the weekly Stochastic, Gold can be expected to fall toward the next support level 1966.00 (bottom of the previous weekly correction (2)).


 GBP | BOE Governor Andrew Bailey Speaks