Categories: Technical analysis

Gold Wave Analysis – 11 March, 2022

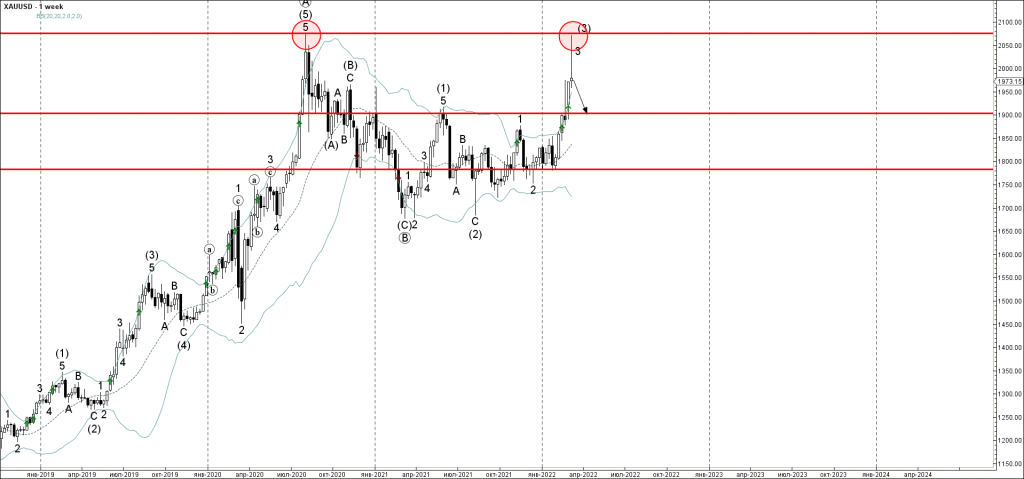
Gold reversed from long-term resistance level 2075.00
• Likely to fall to support level 1900.00

Gold recently reversed down from the powerful long-term resistance level 2075.00 (which stopped the previous sharp upward trend in the middle of 2020) – standing far above the daily and the weekly Bollinger Bands.

The downward reversal from the resistance level 2075.00 stopped the previous impulse waves 3 and (3).

With the easing of the global risk sentiment – Gold can be expected to correct down further toward the next support level 1900.00 (former top of wave (1) from last year).

The FxPro Tech Analysis Team

The FxPro technical experts prepare a daily analysis of the most active currency pairs (majors, crosses, exotics) and commodities. Selected instruments are reviewed on daily trends (D1, H4), using the active Elliott Wave setups, Japanese candlesticks, indicators, and support/resistance levels.

Share
Published by
The FxPro Tech Analysis Team
Tags: gold

Recent Posts

Crypto Market Retreats Due to Overhang of Sellers

Market picture The crypto market has lost 3.3% in the last 24 hours to $2.3…

5 hours ago

USDJPY Wave Analysis 26 April 2024

- USDJPY broke key resistance level 155.00 - Likely to rise to resistance level 160.00…

3 days ago

Ebay Wave Analysis 26 April 2024

- Ebay reversed from support level 49.35 - Likely to rise to resistance level 52.55…

3 days ago

False Alert with Yen Interventions?

Even though the Bank of Japan left the key rate and parameters of the QE…

3 days ago

Cooler Bitcoin

Market picture  Market Dynamics: The cryptocurrency market stabilised, losing just 0.1% of capitalisation and dropping to…

3 days ago

GBPCAD Wave Analysis 25 April 2024

- GBPCAD reversed from key support level 1.6910 - Likely to rise to resistance level…

4 days ago

This website uses cookies