Categories: Technical analysis

GBPUSD Wave Analysis – 27 February 2023

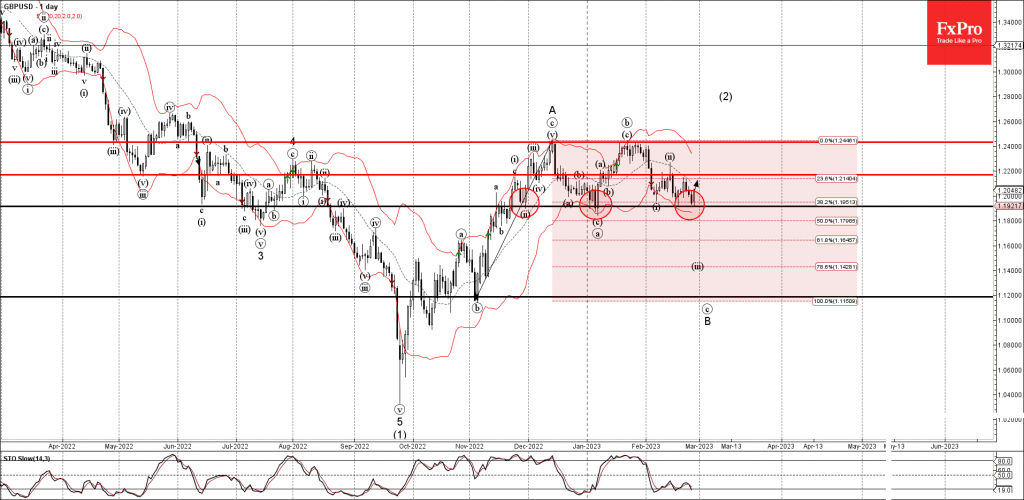
• GBPUSD reversed from key support level 1.1915

• Likely to rise to resistance level 1.2200

GBPUSD recently reversed up from the key support level 1.1915 (which has been reversing the pair from the end of November) intersecting with the lower daily Bollinger Band and the 38.2% Fibonacci correction of the previous upward impulse from November .

The upward reversal from the support level 1.1915 is likely to form the daily candlesticks reversal pattern Bullish Engulfing.

GBPUSD can be expected to rise further toward the next resistance level 1.2200 (which stopped the pervious wave (ii)).

The FxPro Tech Analysis Team

The FxPro technical experts prepare a daily analysis of the most active currency pairs (majors, crosses, exotics) and commodities. Selected instruments are reviewed on daily trends (D1, H4), using the active Elliott Wave setups, Japanese candlesticks, indicators, and support/resistance levels.

Share
Published by
The FxPro Tech Analysis Team
Tags: GBPUSD

Recent Posts

Adobe Wave Analysis 3 May 2024

- Adobe reversed from support zone - Likely to rise to resistance level 500.00 Adobe…

1 day ago

EURGBP Wave Analysis 3 May 2024

- EURJPY reversed from support zone - Likely to rise to resistance level 0.8625 EURGBP…

1 day ago

How Low Can the USDJPY Go?

USDJPY was slipping below 153 on Friday morning, a three-week low and having lost over…

2 days ago

Bitcoin’s Downtrend, Solana and Ethereum Form Double Bottom

Market picture  Crypto market capitalisation rose 3.3% in 24 hours to $2.22 trillion. Local capitalisation…

2 days ago

EURJPY Wave Analysis 2 May 2024

- EURJPY under strong bearish pressure - Likely to fall to support level 163.10 EURJPY…

2 days ago

WTI crude oil Wave Analysis 2 May 2024

- WTI broke round support level 80.00 - Likely to fall to support level 76.00…

2 days ago

This website uses cookies