Categories: Technical analysis

GBPNZD Wave Analysis – 21 May, 2020

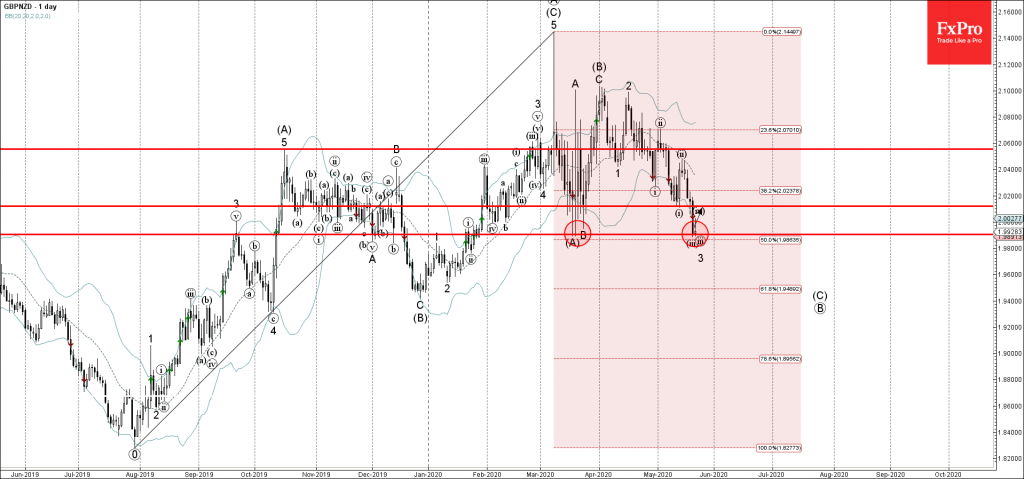
• GBPNZD reversed from long-term support level 1.9900

• Likely to rise to 2.0120

GBPNZD recently reversed up from the long-term support level 1.9900 (which reversed the price sharply in the middle of March), standing near the lower daily Bollinger Band and the 50% Fibonacci retracement of the previous uptrend from July of 2019.

The upward reversal from the support level 1.9900 started the active short-term corrective wave (ii).

GBPNZD is likely to rise further toward the next resistance level 2.0120 (former support from the start of May and the likely target for the completion of wave (iv)).

The FxPro Tech Analysis Team

The FxPro technical experts prepare a daily analysis of the most active currency pairs (majors, crosses, exotics) and commodities. Selected instruments are reviewed on daily trends (D1, H4), using the active Elliott Wave setups, Japanese candlesticks, indicators, and support/resistance levels.

Share
Published by
The FxPro Tech Analysis Team
Tags: GBPNZD

Recent Posts

USDJPY Wave Analysis 6 May 2024

- USDJPY reversed from support zone - Likely to rise to resistance level 155.65 USDJPY…

3 hours ago

Gold Wave Analysis 6 May 2024

- Gold reversed from support zone - Likely to rise to resistance level 2400.00 Gold…

3 hours ago

Oil Bounces Locally, Global Support 5% below Spot Price

The number of operating oil rigs in the US fell by 7 to 499. This…

7 hours ago

Crypto Market Tries to Break Local Downtrend

Market picture  Crypto market capitalisation has been up 2% over the past seven days and…

14 hours ago

Adobe Wave Analysis 3 May 2024

- Adobe reversed from support zone - Likely to rise to resistance level 500.00 Adobe…

3 days ago

EURGBP Wave Analysis 3 May 2024

- EURGBP reversed from support zone - Likely to rise to resistance level 0.8625 EURGBP…

3 days ago

This website uses cookies