Categories: Technical analysis

GBPCAD Wave Analysis 9 March, 2021

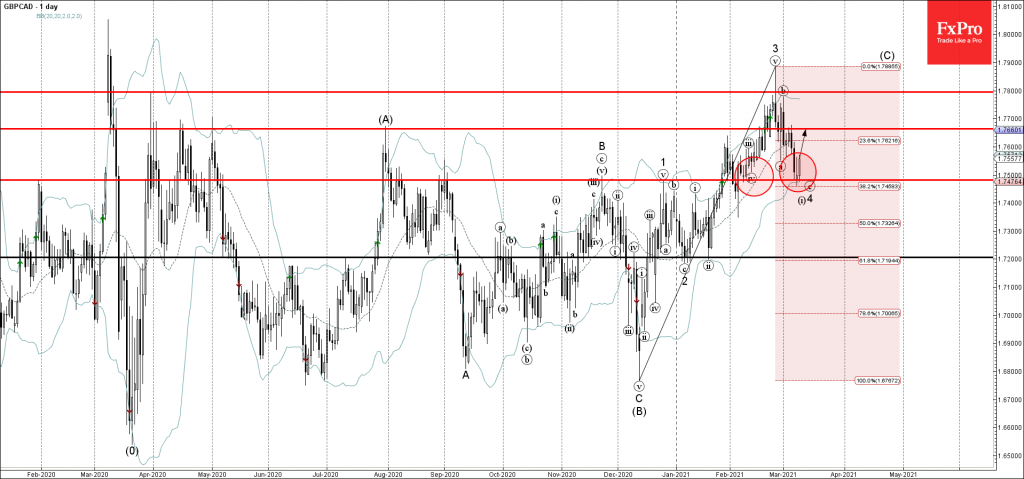
• GBPCAD reversed from the support level 1.7480

• Likely to reach resistance level 1.7660

GBPCAD recently reversed up from the support level 1.7480 (former low of wave (iv) from February) – intersecting with the lower daily Bollinger Band and 38.2% Fibonacci correction of the upward impulse from December.

The price will create the daily candlesticks reversal patter Morning Star – if the pair closes today near the current levels.

Given the clear bullish sterling sentiment seen today – GBPCAD is likely to rise further toward the next resistance level 1.7660 (previous minor reversal pivot).

The FxPro Tech Analysis Team

The FxPro technical experts prepare a daily analysis of the most active currency pairs (majors, crosses, exotics) and commodities. Selected instruments are reviewed on daily trends (D1, H4), using the active Elliott Wave setups, Japanese candlesticks, indicators, and support/resistance levels.

Share
Published by
The FxPro Tech Analysis Team
Tags: GBPCAD

Recent Posts

Crypto Market Retreats Due to Overhang of Sellers

Market picture The crypto market has lost 3.3% in the last 24 hours to $2.3…

9 hours ago

USDJPY Wave Analysis 26 April 2024

- USDJPY broke key resistance level 155.00 - Likely to rise to resistance level 160.00…

3 days ago

Ebay Wave Analysis 26 April 2024

- Ebay reversed from support level 49.35 - Likely to rise to resistance level 52.55…

3 days ago

False Alert with Yen Interventions?

Even though the Bank of Japan left the key rate and parameters of the QE…

3 days ago

Cooler Bitcoin

Market picture  Market Dynamics: The cryptocurrency market stabilised, losing just 0.1% of capitalisation and dropping to…

3 days ago

GBPCAD Wave Analysis 25 April 2024

- GBPCAD reversed from key support level 1.6910 - Likely to rise to resistance level…

4 days ago

This website uses cookies