Categories: Technical analysis

GBPCAD Wave Analysis – 30 June, 2020

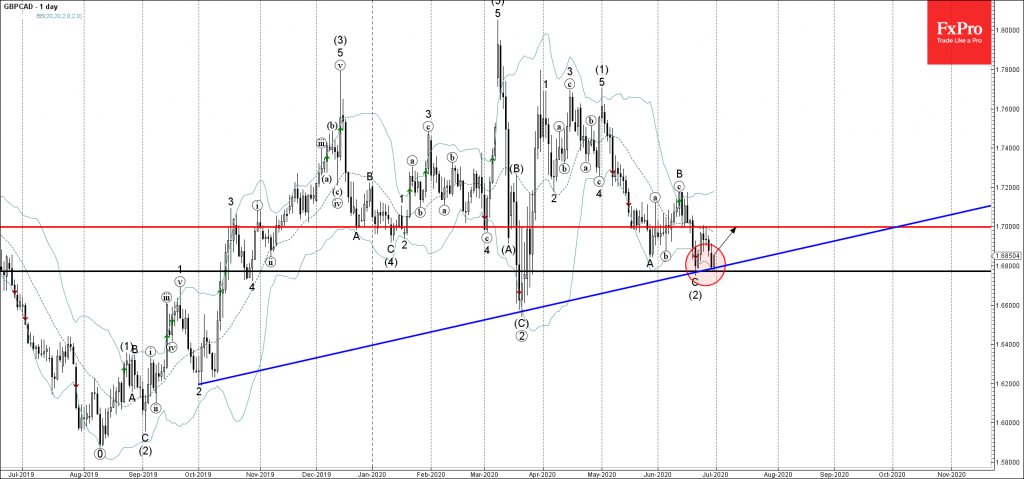
• GBPCAD reversed from support level 1.6800

• Likely to rise to 1.7000

GBPCAD recently reversed up from the support level 1.6800 (low of the previous medium-term ABC correction (2)), intersecting with the lower daily Bollinger Band and the ascending support trendline from last October.

The upward reversal from the support level 1.6800 is similar to the earlier reversal from the same level – which created the daily Piercing line earlier this month. GBPCAD is likely to rise further toward the next round resistance level 1.7000 (top of the previous minor correction).

The FxPro Tech Analysis Team

The FxPro technical experts prepare a daily analysis of the most active currency pairs (majors, crosses, exotics) and commodities. Selected instruments are reviewed on daily trends (D1, H4), using the active Elliott Wave setups, Japanese candlesticks, indicators, and support/resistance levels.

Share
Published by
The FxPro Tech Analysis Team
Tags: GBPCAD

Recent Posts

USDJPY Wave Analysis 6 May 2024

- USDJPY reversed from support zone - Likely to rise to resistance level 155.65 USDJPY…

12 hours ago

Gold Wave Analysis 6 May 2024

- Gold reversed from support zone - Likely to rise to resistance level 2400.00 Gold…

12 hours ago

Oil Bounces Locally, Global Support 5% below Spot Price

The number of operating oil rigs in the US fell by 7 to 499. This…

17 hours ago

Crypto Market Tries to Break Local Downtrend

Market picture  Crypto market capitalisation has been up 2% over the past seven days and…

23 hours ago

Adobe Wave Analysis 3 May 2024

- Adobe reversed from support zone - Likely to rise to resistance level 500.00 Adobe…

3 days ago

EURGBP Wave Analysis 3 May 2024

- EURGBP reversed from support zone - Likely to rise to resistance level 0.8625 EURGBP…

3 days ago

This website uses cookies